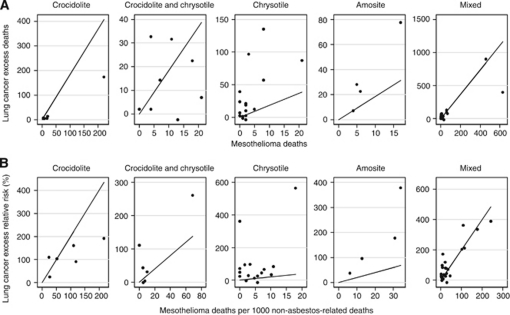
Figure 1.
(A) Ratio 1 components, absolute excess lung cancer excess deaths vs mesothelioma deaths, by asbestos type. (B) Ratio 2 components, lung cancer excess relative risk (%) vs mesothelioma deaths per 1000 non-asbestos-related deaths, by asbestos type. Note that graphs are not to the same scale. The reference line on each sub-graph corresponds to the same ratio estimate (average values for mixed fibres from Table 3); thus, the distribution of points about this line can be compared across subgraphs.

