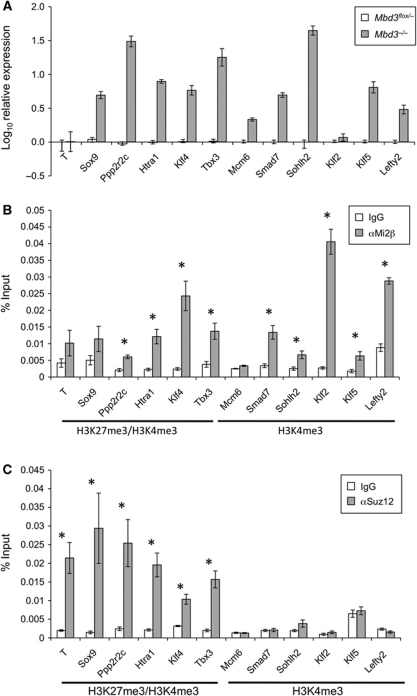
Figure 1.
Identification of direct gene targets for NuRD and PRC2. (A) Quantitative RT–PCR comparing transcript levels in Mbd3−/− ES cells to those in wild-type ES cells. Results are plotted as log10 fold change relative to wild-type levels. Error bars indicate standard error of the mean (s.e.m.). (B) Chromatin IP in wild-type cells for either Mi2β or IgG control, with qPCR for proximal promoter regions of genes shown. Results are plotted as percentage of input DNA. Histone signatures (according to Mikkelsen et al, 2007) are indicated underneath. Asterisks denote loci at which ChIP for Mi2β is significant with respect to IgG control (P<0.005). (C) Chromatin IP in wild-type cells for either Suz12 or IgG control, plotted as percentage of input DNA. Histone signatures are indicated underneath. Asterisks denote loci where ChIP for Suz12 is significant with respect to IgG control (P<0.005). Error bars indicate s.e.m.

