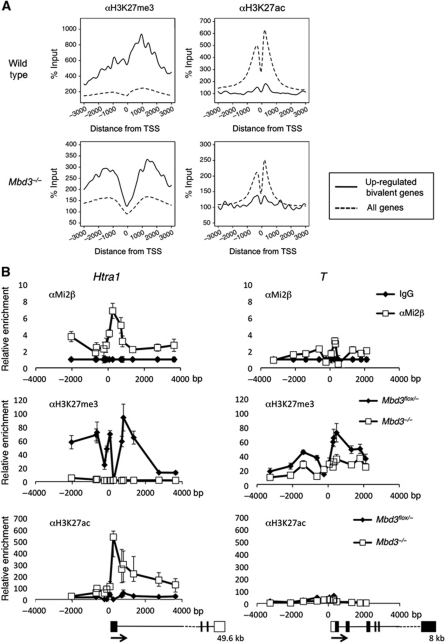
Figure 3.
ChIP-seq analysis, reciprocal changes of H3K27me3 and H3K27ac levels in the absence of NuRD. (A) ChIP-seq for H3K27me3 or H3K27ac in wild-type or Mbd3−/− cells: average signal profiles, normalised to input, are shown for upregulated, bivalent genes (solid line) relative to all RefSeq (Pruitt et al, 2007) genes in each data set (dotted line) for a 6-Kb region spanning the transcription start site (TSS). Distance from TSS is indicated in base pairs. (B) ChIP for H3K27me3 and H3K27ac in wild-type and Mbd3-null cells and for Mi2β in wild-type cells at one target gene (Htra1) and one non-target gene (T). Data are shown relative to IgG control, distance from TSS is measured in base pairs as the mid point of PCR product. Outlines of the gene structures are indicated, with the total length of the transcriptome indicated below (not to scale). Error bars indicate s.e.m.

