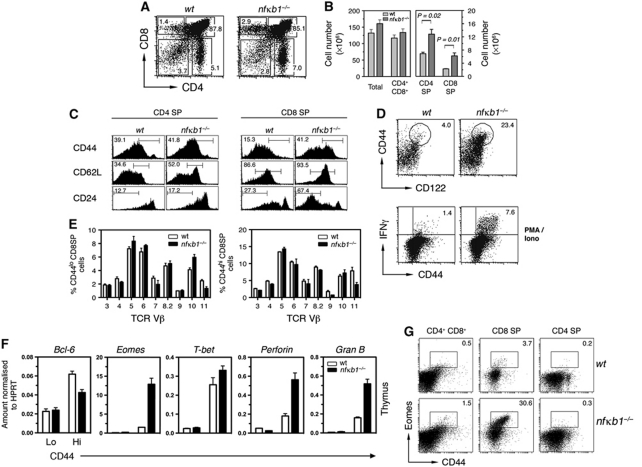
Figure 1.
nfκb1−/− CD8SP thymocytes display memory characteristics. (A) CD4 and CD8 expression by thymocytes from 8-week-old wt and nfκb1−/− mice with numbers showing percentages of cells in each gate. (B) Mean (±s.e.m.) numbers of thymocyte subsets in wt and nfκb1−/− mice. Data consist of one cohort (n=3 mice per genotype). (C) Phenotype of wt and nfκb1−/− CD4 and CD8 SP thymocytes (n=7 mice per genotype). (D) Expression of CD44 and CD122 by wt and nfκb1−/− CD8SP thymocytes. Values indicate percentages of CD44hiCD122hi cells and data represent seven mice per genotype. IFN-γ and CD44 expression gated on wt and nfκb1−/− CD8SP thymocytes after 5 h of stimulation with PMA (10 ng/ml) plus ionomycin (1 μg/ml) (n=6 mice per genotype). (E) Proportion of Vβ TCRs (x axis) gated on CD8SP CD44lo or CD44hi thymocytes for wt and nfκb1−/− mice (mean±s.e.m.; n=3 per genotype). (F) Relative expression of Bcl-6, Eomes, T-bet, Perforin and Granzyme B mRNA in wt and nfκb1−/− CD44lo and CD44hi CD8SP thymocytes (cells were purified from four mice per genotype for each experiment). Graphs show mean±s.d. from triplicate reactions. (G) Expression of Eomes and CD44 by wt and nfκb1−/− thymocyte subsets (n=4 mice per genotype). Values indicate percentages of cells in each gate. Data shown are representative of seven (A), five (B), four (C, G), three (D) and two (E, F) independent experiments. P-values were determined by an unpaired two-tailed Student's t-test.

