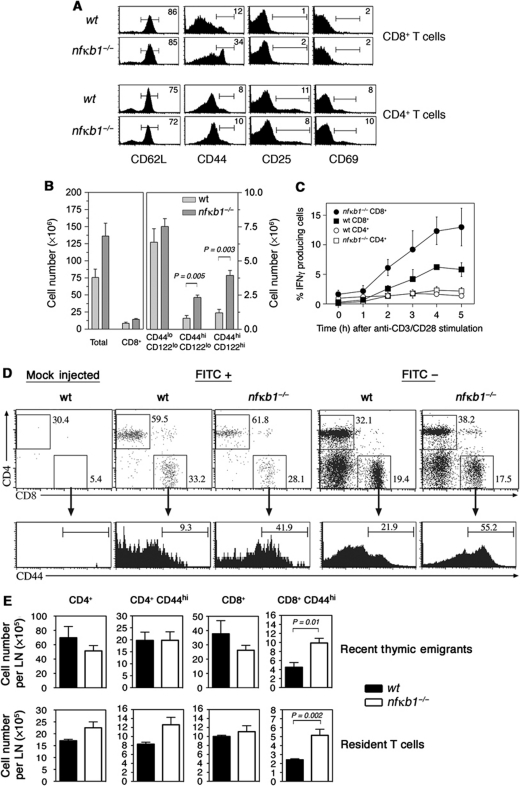
Figure 8.
Thymic memory-like CD8+ T cells populate the periphery of nfκb1−/− mice. (A) Phenotype of wt and nfκb1−/− CD4+ and CD8+ splenic T cells. Values indicate percentages of cells in gated areas. Data represent at least nine mice per genotype. (B) Mean (±s.e.m.) numbers of total splenocytes, CD8+ T cells, naive (CD44loCD122lo) and memory-like (CD44hiCD122lo and CD44hiCD122hi) CD8+ T cells. Expression of CD44 and CD122 by wt and nfκb1−/− splenic CD8+ T cells is shown in Supplementary Figure S3E. Data in (A) and (B) are representative of three experiments (n>9 mice per genotype). (C) Percentages of IFN-γ producing T cells from wt and nfκb1−/− mice. Splenocytes were stimulated with plate-bound anti-CD3/anti-CD28 Abs (both 10 μg/ml) and stained for IFN-γ, CD4 and CD8 expression. Stains were performed on duplicate samples every hour and sample flow profiles shown in Supplementary Figure S3E. Data are representative of two independent experiments. (D) Memory-like CD8+ T cells home to the periphery of nfκb1−/− mice. Wt and nfκb1−/− mice were injected intrathymically with FITC or PBS (mock injected). After 20 h, mice were euthanised and mesenteric lymph nodes harvested and processed for immunofluorescent staining. FITC+ (Recent Thymic Emigrants) and FITC− (Resident) T cells were examined for CD4 and CD8 expression. Values indicate percentages of cells in each gated region. CD44 expression gated on Recent Thymic Emigrants or Resident CD8+ T cells from wt and nfκb1−/− mice. (E) Absolute numbers of RTE and resident T cells (mean±s.e.m.; n=5 per genotype) calculated from T-cell percentages and total lymph node cell numbers. P-values were determined by an unpaired two-tailed Student's t-test.

