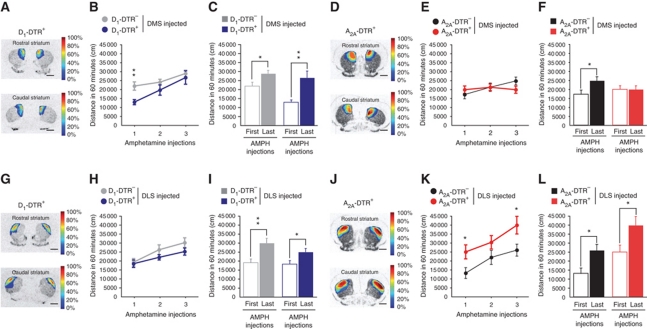
Figure 10.
Amphetamine locomotor sensitization after D1R or D2R MSN ablation in the DMS or DLS. (A, D, G, J) Topographic representation of the lesioned areas in D1-DTR+ (A, G) and A2A-DTR+ (D, J) DT-injected mice into the DMS (A, D) or the DLS (G, J). Colours represent percent of superimposed lesioned areas. (B, C, E, F, H, I, K, L) Locomotor activity in a 60-min open field after repeated d-amphetamine (3 mg/kg) administration in DMS D1-DTR (B, C) and A2A-DTR (E, F) or DLS D1-DTR (H, I) and A2A-DTR (K, L) DT-injected mice. Histograms represent ambulation following first and last d-amphetamine administration. Data are reported as mean±s.e.m. (n=10–17 per group). Statistical comparisons were made between DTR+ and respective DTR− control mice (dot chart) or between first and last amphetamine injection (histograms). *P<0.05, **P<0.01.

