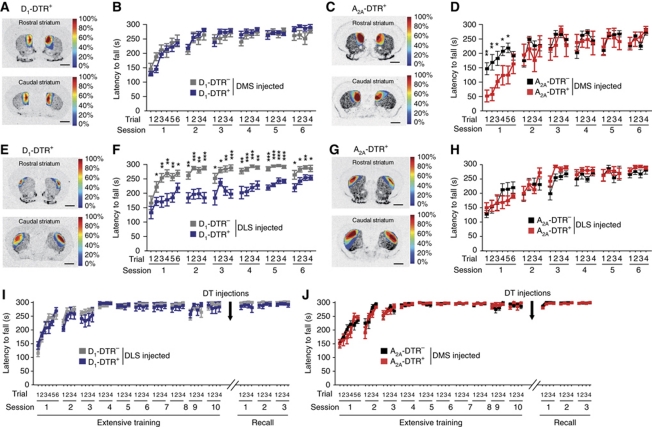
Figure 8.
Rotarod performance after ablation of D1R and D2R MSNs in the DMS or DLS. (A, C, E, G) Topographic representation of the lesioned areas in D1-DTR+ (A, E) and A2A-DTR+ (C, G) DT-injected mice into the DMS (A, D) or the DLS (E, G). Colours represent percent of superimposed lesioned areas. (B, D, F, H) Rotarod performance of DMS D1-DTR+ (B) and A2A-DTR+ (D) and DLS D1-DTR+ (F) and A2A-DTR+ (H) DT-injected mice and respective controls. (I, J) Ten days of rotarod training and three days of performance recall one week after DT injections in DLS of D1-DTR (I) and DMS of A2A-DTR (J) mice; respective topographic representation of the lesioned areas can be found on Figure 5F and J. Data are reported as mean±s.e.m. (n=7–9 per group). Statistical comparisons were made between DTR+ and respective DTR− control mice. *P<0.05, **P<0.01, ***P<0.001.

