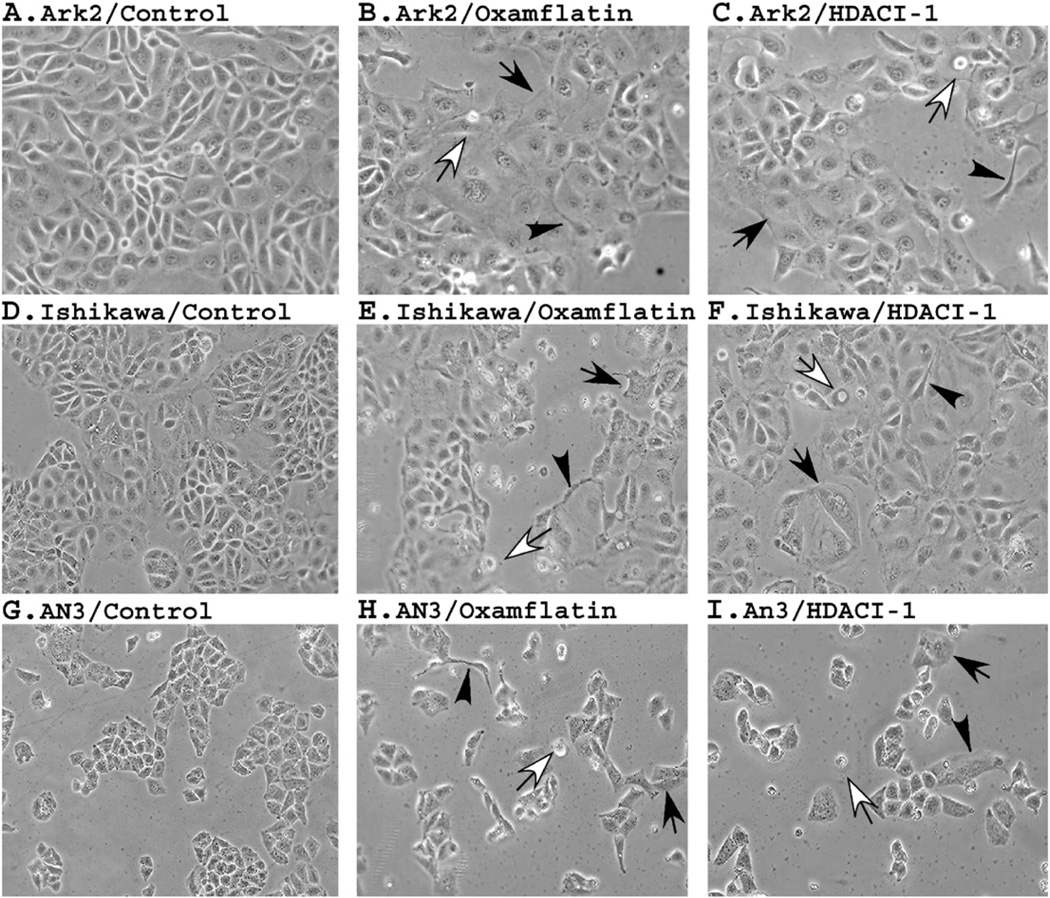
Figure 4.
Morphological changes induced by HDAC inhibitors. The three cell cultures were treated with oxamflatin (0.25 μM) and HDAC-I1 (0.5 μM) and pictures were taken after 3 days' treatment. Generally, upon treatment cells tend to become round and enlarged (indicated by solid arrows). Many dead cells can be seen floating in the medium (open arrows). Some treated cells form digitiform processes (indicated by arrowheads). The two reagents appear to induce similar morphological changes in given cell lines.

