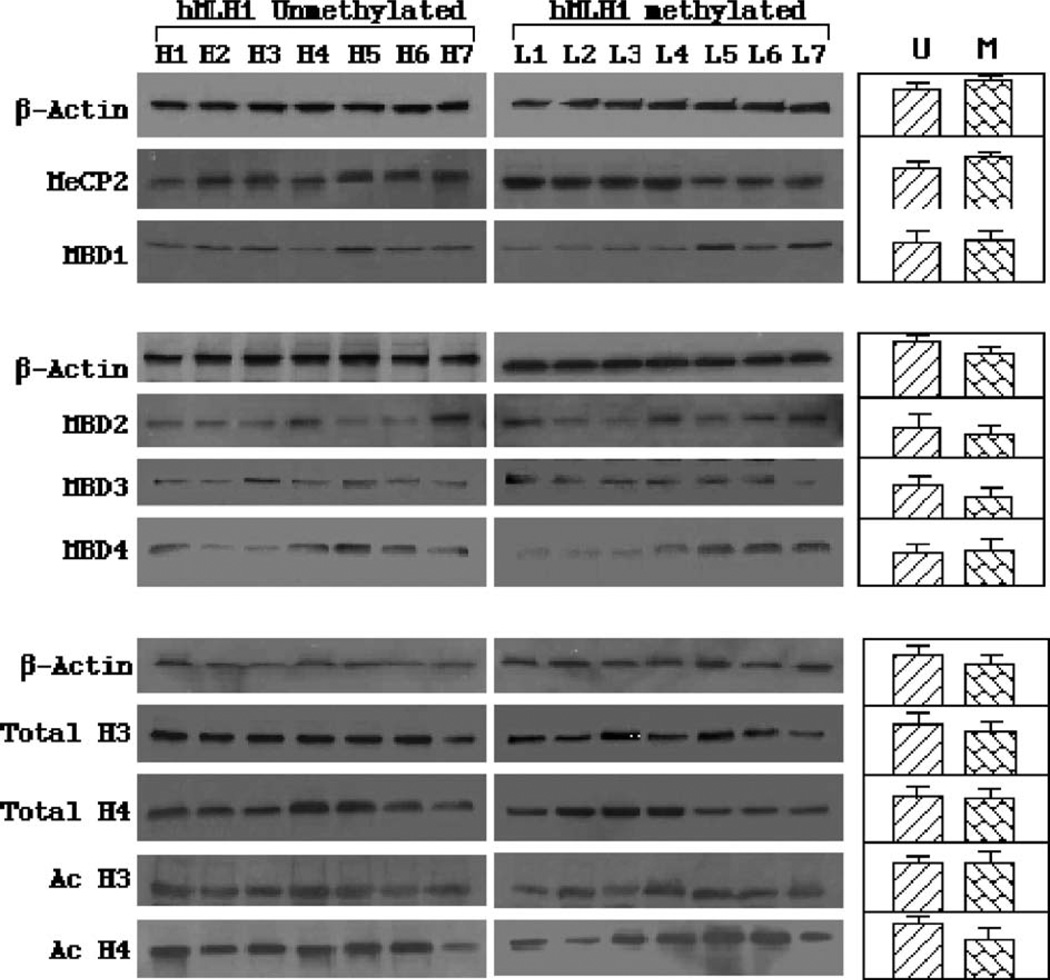
Fig. 5.
Total cellular levels of MBD and histone proteins. Western blot analysis was performed on MBDs, total histone H3 and H4 and acetylated H3 and H4. The left panels are some example results representing at least three repeated Western blot experiments. The right panels show the result of densitometry analysis on multiple cancer samples. No statistically significant difference in average concentrations of MBDs and histones was found between cancer groups containing unmethylated and methylated MLH1 genes. For each blot, the β-actin protein levels were also measured for loading controls.

