
Fig. 1.
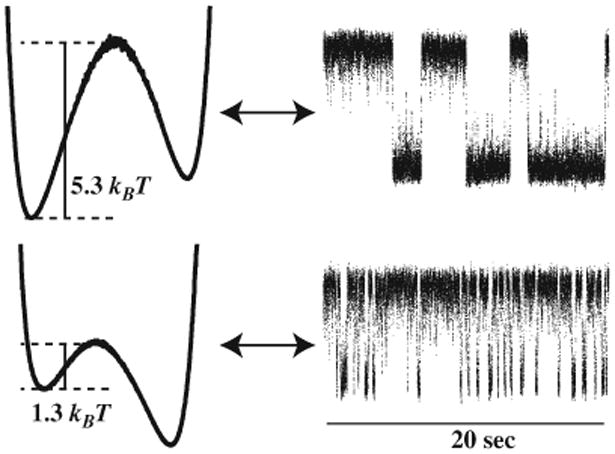
Sculpted energy landscapes (left, averaged 20 minutes) and the corresponding microtrajectories. The trace is raw data; states are assigned after boxcar filtering and threshold finding. Top: The lower state is slightly more populated; there is a high barrier (infrequent transitions). Bottom: The upper state is more populated; the barrier is small (frequent transitions). The distance between the two potential minima ranges from 200 to 700 nm.