Figure 6.
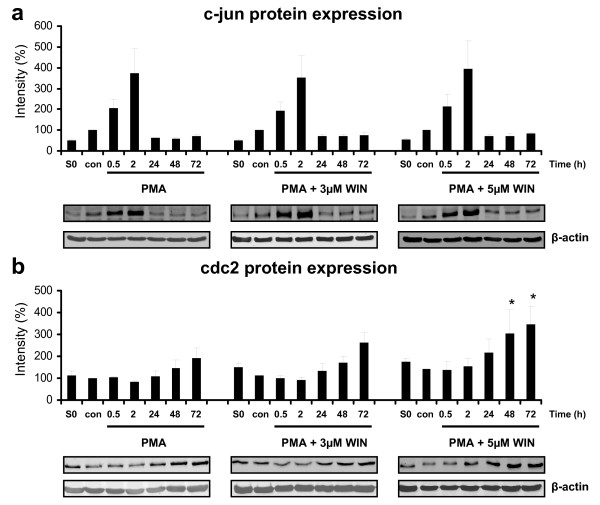
Immunoblot analysis of c-jun and cdc2 protein expression in PMA-induced U937 cells co-incubated with WIN55212-2. Differentiation of U937 cells was induced by 25 nM PMA with or without co-incubation with WIN55212-2. The experimental groups were: 1.) Vehicle control = treatment with 0.1% DMSO only (con), 2.) Differentiation control = treatment with 25 nM PMA (0), 3.) Experimental groups were treated additionally with 3 μM (3) or 5 μM (5) WIN55212-2, respectively. C-jun (figure 5a) and cdc2 (figure 5b) protein expression was analysed by immunoblotting and quantified by Odyssey infrared imaging system (Li-Cor Biosciences) and shown as mean +/- SEM, n = 3. Relative intensities were normalized to non-induced control cells (con) and an internal control (S0) for quantification if different blot membranes have been used. *p < 0.05. One representative blot and one representative beta-actin control out of 3 is shown.

