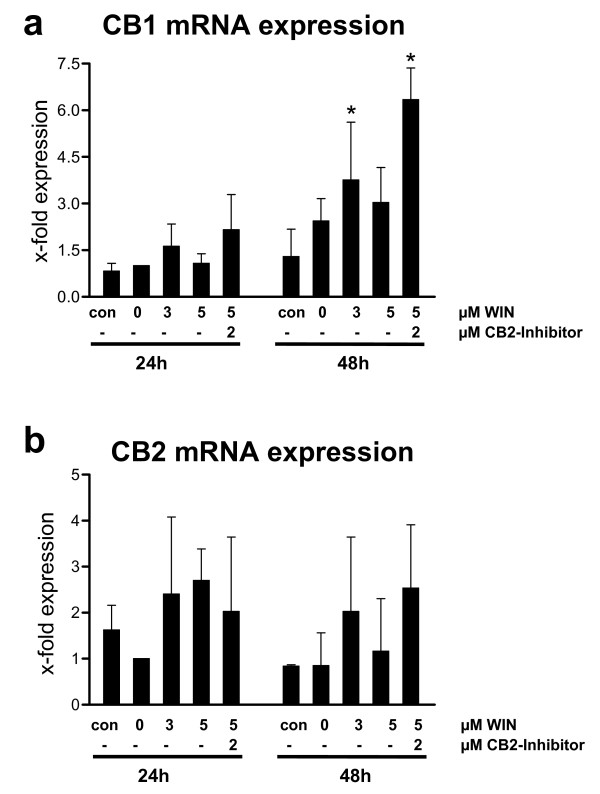
Figure 9.
Quantitative real time PCR analysis of CB1 and CB2 receptor mRNA expression in PMA-induced U937 cells co-incubated with WIN55212-2. Differentiation of U937 cells was induced by 25 nM PMA with or without co-incubation with WIN55212-2. The experimental groups were: 1.) Vehicle control = treatment with 0.1% DMSO only (con), 2.) Differentiation control = treatment with 25 nM PMA (0), 3.) Experimental groups were treated additionally with 3 μM (3) or 5 μM (5) WIN55212-2, respectively. One group was treated with 5 μM (5) WIN55212-2 and 2 μM WIN AM630 (CB2 inhibition). CB1 (figure 9a) and CB2 (figure 9b) receptor mRNA expression were analysed after different time points by quantitative real-time PCR. Data are shown as mean +/- SD, n = 3. Relative expression were normalized to GAPDH expression in non-induced cells. *p < 0.05.

