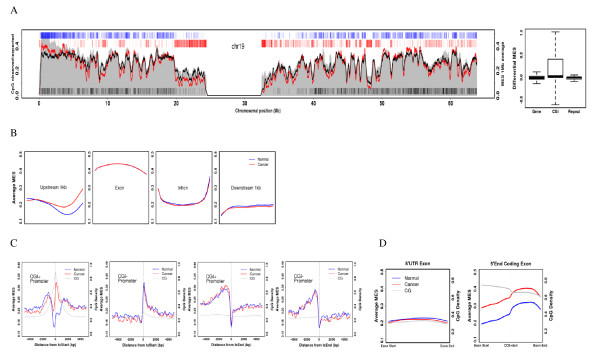
Figure 2.
Comparison of methylation patterns in normal and cancerous tissue. (A) Average MES curve for normal (black) and cancerous (red) tissue in chromosome 19 (left). The average MES for CGIs, gene bodies, and repeats (right).(B) DNA methylation of gene annotated elements. Each element (upstream 1 kb, exon, intron, and downstream 1 kb) were partitioned into 20 bins and the average MES was obtained for each bin of all corresponding elements. (C) DNA methylation at transcript ends and coding region ends. The average MES was obtained in a sliding 50-bp window according to its distance from the transcript start (first) and end (second) for CGI-positive promoters as well as the transcript start (third) and end (fourth) for CGI-positive promoters. (D) DNA methylation of total 5' UTR exons (left) and 5' UTR coding exons (right).

