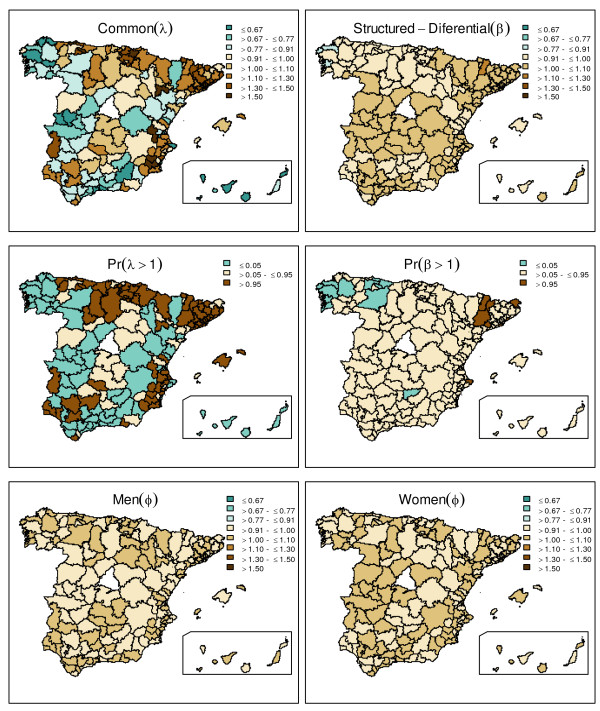
Figure 2.
Gender differences in the risk of admission: shared and differential components. Map representing the posterior median of the shared spatial component is shown at the top left; whereas female-male differential spatial component is mapped at the top right. At the middle row, posterior probabilities for a risk being above 1 are shown for both, shared and differential components. Unstructured posterior median for the specific-gender components is shown at the bottom row. Dark brown color in the posterior probability maps represents areas where the probability for each component (common eλ and structured discrepant eβ, respectively), of having a relative risk of admission higher than 1 is above 0.95.

