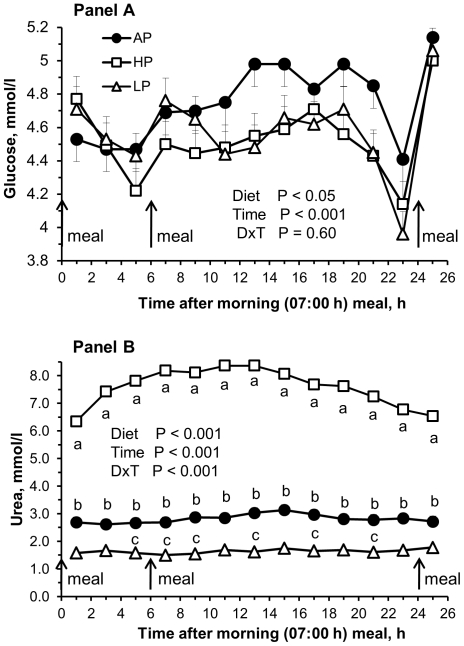
Figure 1. Diurnal plasma glucose and urea concentrations at 92 dpc.
Diurnal plasma metabolite concentrations of sows at 92 dpc fed isoenergetic diets with low protein∶high carbohydrate (LP; open triangles), adequate protein∶carbohydrate (AP; closed circles), and high protein∶low carbohydrate (HP; open squares) ratios throughout pregnancy. Values are depicted from one hour after feeding the morning meal (50% of the daily allowance at 07:00h) to the midday meal (13:00 h) until the next day one hour after morning meal (08:00 h). Panel A, glucose; panel B, urea; Values are least square means ± SE, n = 9 per group. Inserts depict P values for the main factors diet and time and interactions. a,b,c Within time points, values with different lower case letters indicate significant differences (P<0.05) between diet groups.

