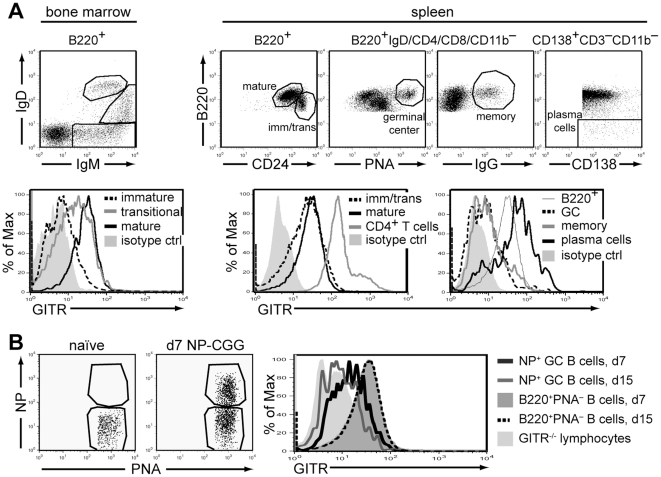
Figure 1. B cells express GITR starting at the transitional stage of development.
(A) Bone marrow and spleen cells from wild-type (129S1) mice were analyzed ex vivo by flow cytometry for the expression of indicated markers. Live cells in dot plots were gated as indicated on top. Histograms depict GITR expression on B cells in subsets gated as shown in the dot plots in top panel. Expression of GITR on gated CD4+ T cells is shown as a positive control for GITR staining. Rat IgG2b was used as an isotype control for GITR staining. Data are representative of 3 independent experiments. Similar GITR expression was observed on B cells from BALB/c mice (data not shown). (B) GITR+/+ (BALB/c) mice were immunized i.p. with 100 µg NP39-CGG in Alum. At days 4, 7, and 15 post immunization, spleen cells were harvested from 2 immunized and 2 nonimmunized (naïve) mice at each point and analyzed for GITR expression on germinal center B cells reactive with NP. The dot plots show NP and PNA binding on B220+PNAhigh gated B cells from one naive (left panel) and one immunized (right panel) mouse at day 7. There were no NP+ germinal center B cells at day 4, and reduced frequency at day 15 (data not shown). The histogram represents live, B220+IgD−CD3−CD11b−PNAhigh germinal center B cells. GITR expression on NP+ germinal center B cells of one mouse at day 7 (black intact line) and one mouse at day 15 (gray intact line) following immunization are shown compared to those on total B220+PNA− B cells (dark-shaded histogram and dashed black line) in respective animals and on lymphocytes of one GITR−/− mouse (light-shaded histogram).

