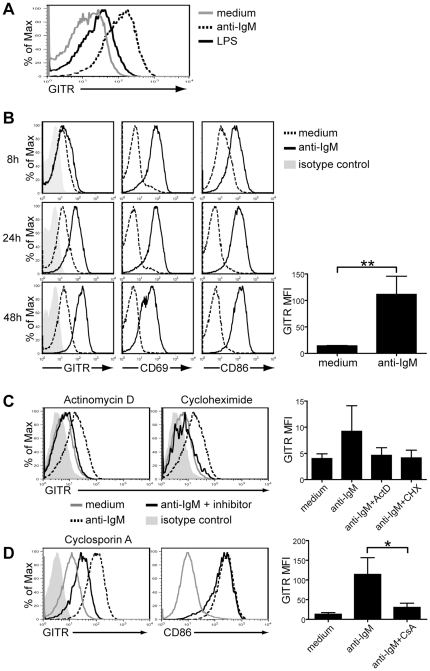
Figure 2. BCR stimulation enhances GITR expression on B cells.
B cells were purified from the spleen of BALB/c mice by negative selection and all B cell cultures were performed in the presence of 4 ng/ml of BAFF to sustain cell survival. (A) Representative GITR expression on B cells cultured for 48 h in medium alone (gray line) or in the presence of either 10 µg/ml F(ab′)2 anti-IgM antibodies (dashed line) or 20 µg/ml LPS (intact black line). (B) B cells were cultured in either medium alone (dashed line) or with 10 µg/ml F(ab′)2 anti-IgM antibodies (intact line). Expression of GITR, CD69 and CD86 were analyzed at 8, 24 and 48 h of culture. The bar graph represents average GITR mean fluorescent intensity (MFI) on B cells cultured with medium or anti-IgM antibodies for 48 h from 3 independent experiments. **p≤0.002, n = 3. (C) B cells were stimulated in culture for 24 h with 10 µg/ml F(ab′)2 anti-IgM antibodies without (dashed line) or with 0.1 µM actinomycin D (ActD) to inhibit transcription, or 2 µM cycloheximide (Chx) to inhibit protein synthesis (intact black line). Gray line indicates GITR expression on cells cultured in medium alone. The diluent DMSO (0.2–0.4%) was present in all cultures. The bar graph represents average GITR MFI on B cells cultured with medium, anti-IgM antibodies, or anti-IgM antibodies with the indicated inhibitor from 3 independent experiments. Differences were not statistically significant, but were observed in all three independent experiments. (D) GITR (left) and CD86 (right) expression on B cells cultured for 48 h with 10 µg/ml F(ab′)2 anti-IgM antibodies alone (dashed line) or in the presence of 0.2 µM of cyclosporin A (CsA, intact black line). Expression on B cells cultured in medium alone (gray line) is shown for comparison. The bar graph represents average GITR MFI on B cells cultured with medium, anti-IgM antibodies, or anti-IgM antibodies with CsA from 3 independent experiments. *p≤0.05, n = 3. All histograms represent live, B220+ lymphoid cells. Isotype control staining for GITR (light shaded histogram) is shown in (B) and (C) and it was similar on stimulated or nonstimulated cells (data not shown). Data are representative of 2–6 independent experiments.

