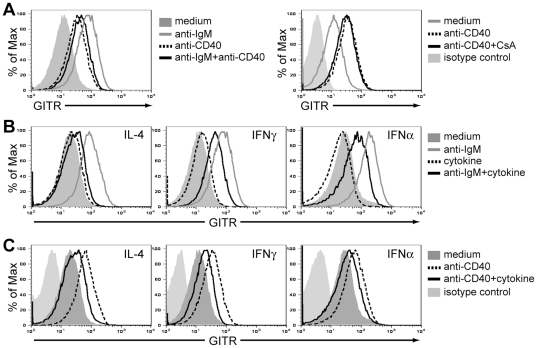
Figure 3. Helper T cell factors inhibit GITR induction on BCR-stimulated B cells.
B cells were purified from the spleen of wild-type BALB/c mice by negative selection and used for in vitro analyses. All B cell cultures were performed in the presence of 4 ng/ml of BAFF to sustain cell survival. (A) GITR expression on B cells cultured for 48 h in medium alone, with 2 µg/ml F(ab′)2 anti-IgM antibodies (gray line, left panel), 15 µg/ml anti-CD40 antibodies (dashed line, left and right panels), a combination of anti-IgM and anti-CD40 antibodies (intact black line, left panel), or a combination of anti-CD40 antibodies and 0.2 µM CsA (intact black line, right panel). (B) GITR expression on B cells cultured for 48 h in medium alone (filled histogram), 2 µg/ml F(ab′)2 anti-IgM antibodies (gray line), 50 ng/ml IL-4, 100 (not shown) and 1000 U/ml IFNγ, 100 (not shown) and 1000 U/ml IFNα (dashed line) or a combination of anti-IgM antibodies and cytokines (intact black line) as indicated. There was no difference between 100 and 1000 U/ml of IFNγ and IFNα (data not shown). Isotype control staining for GITR (light shaded histogram) is shown in (A) and (B) and it was similar on stimulated or nonstimulated cells (data not shown). (C) GITR expression on B cells cultured with 15 µg/ml anti-CD40 antibodies alone (dashed line) or in combination with 50 ng/ml IL-4, 1000 U/ml IFNγ, or 1000 U/ml IFNα (intact line), as indicated. Note that the isotype control antibody staining was included in all analyses but omitted in plots that display more than 3 samples for clarity.

