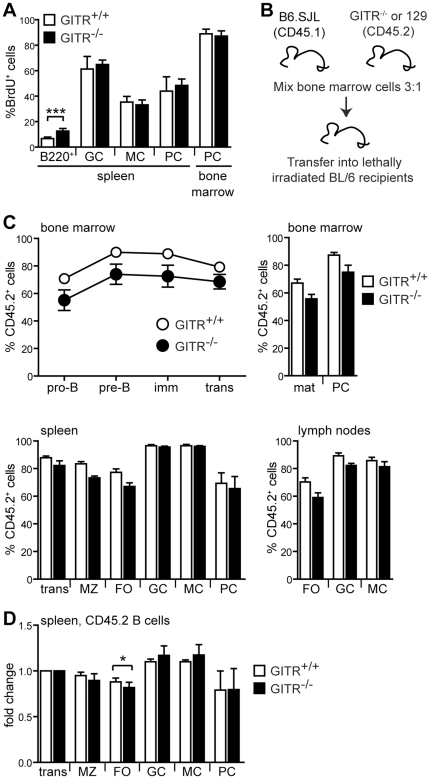
Figure 7. GITR appears dispensable for entry of B cells in the active cell subsets.
(A) GITR+/+ (129S1, white bars) and GITR−/− (black bars) mice (n = 5) were fed BrdU continuously for one week. Bars represent frequency of BrdU+ cells in naïve B220+ (PNA−), germinal center (GC), memory (MC), and plasma (PC) cell compartments gated as shown in Fig. 1. Error bars represent SD. ***p≤0.003. Similar results were found in mice fed BrdU for two weeks (data not shown). (B) Schematic for the generation of GITR-deficient and sufficient mixed bone marrow chimeras. Bone marrow cells from CD45.2 GITR−/− and GITR+/+ 129S1 mice were mixed at a 1∶3 ratio with bone marrow cells isolated from CD45.1 C57BL/6 SJL mice. Cell mixtures were injected i.v. into lethally irradiated C57BL/6 mice, which were evaluated 8 weeks later. (C) Bone marrow, spleen and lymph nodes from mixed bone marrow chimeras (n = 5 per group) generated as described in (B) were analyzed by flow cytometry to determine the frequency of CD45.2+ cells in B cell subsets. B cell subsets were gated as described in Figs. 1 and 4. Open bars and symbols represent CD45.2+ GITR+/+ B cells and filled bars and symbols represent CD45.2+ GITR−/− B cells. The graphs represent means and SEM for each indicated B cell subset. (D) The relative size of the CD45.2+ B cell population in each spleen B cell compartment was measured relative to that of the transitional B cell population in each mouse described in (C). The bar graph represents the average fold change (+SEM) in the size of each CD45.2 B cell subset relative to the transitional B cell subset, which was set at 1. Open bars represent CD45.2+ GITR+/+ B cells and filled bars represent CD45.2+ GITR−/− B cells. *p<0.05.

