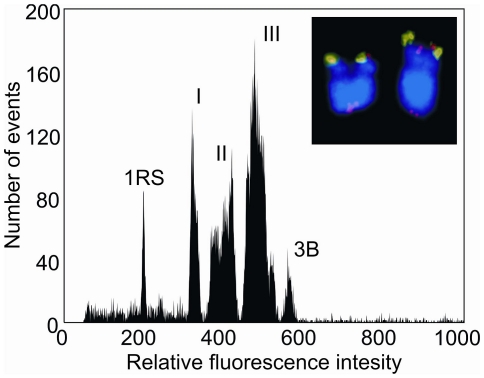
Figure 1. Histogram of relative fluorescence intensity (‘flow karyotype’) obtained after flow cytometric analysis of DAPI-stained chromosome suspension of wheat-rye 1RS telosome addition line.
The karyotype contains four peaks representing the chromosomes of wheat (labelled I, II, III, and 3B) and a peak of the telocentric chromosome 1RS. The peak of chromosome 1RS is clearly discernible and chromosomes can be easily sorted. Insert: Images of the flow-sorted chromosome 1RS after FISH with probes for telomeric sequences (red) and pSc200 (green) subtelomeric DNA sequences. The chromosomes were counterstained with DAPI (blue).

