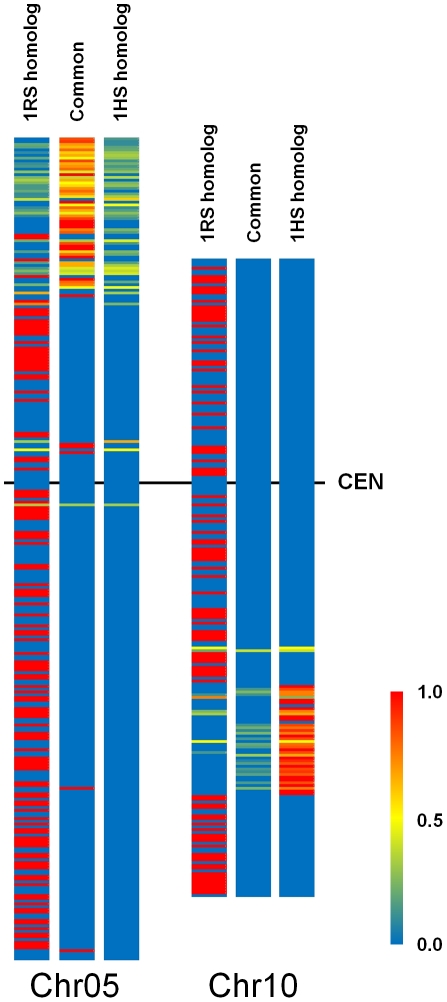
Figure 3. Comparison of the gene content of 1RS and 1HS based on Chr.5 and Chr.10 of the model rice genome.
The in silico generated 105 bp virtual bins of chromosomes 5 and 10 of rice were used as platforms to compare the gene content of 1RS and 1HS homolog to rice. Similarity of 1RS to 1HS concerning a particular rice bin was judged by estimating the portion of common loci over all homolog loci in a particular bin as described in Material and Methods. The colour bar shows the level of similarity starting from 0 (blue) to 1 (complete similarity; red) meaning that all hit loci show homology to both 1RS and 1HS. Common: distribution of bins containing genes homolog to both 1RS and 1HS. 1RS homolog: bins containing genes homolog to 1RS, 1HS homolog: distribution of bins containing genes homolog to 1HS. In the two latter cases red colour defines bins with genes representing exclusively either 1RS or 1HS homologs.

