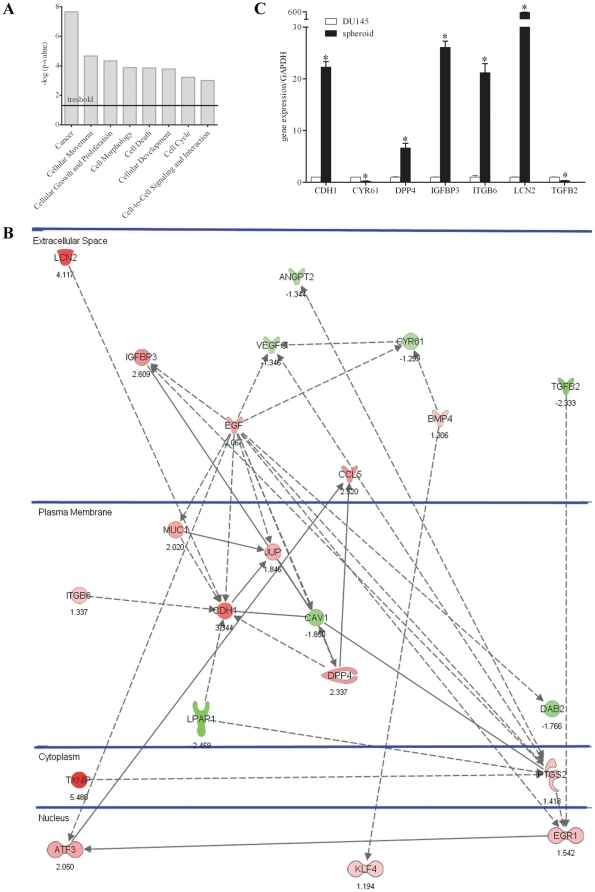
Figure 5. Analysis of CSC vs DU145 cells by microarray, IPA and Q-PCR analysis.
(A) Selected 8 top biological functions found enriched within the set of transcripts modulated in CSC with respect to total DU145 cells by microarray analysis. (B) The 22 deregulated genes, as determined by IPA, are positioned in subcellular layouts, and relationships are marked by arrows: filled and dashed line arrows mark direct and indirect interactions, respectively. Genes in red showed increased expression in CSC, while genes in green were down-regulated. (C) Differences in gene expression determined by microarray analysis were confirmed by Q-PCR, choosing 7 representative genes among selected 22. Results are expressed as ratio between each target gene and the endogenous control GAPDH. Expression in CSC was compared to what was observed in DU145 cells to which a value equal to 1 was arbitrarily assigned. Values are mean ± SEM from 3 experiments. *, p<0.05 relative to DU145 cells.

