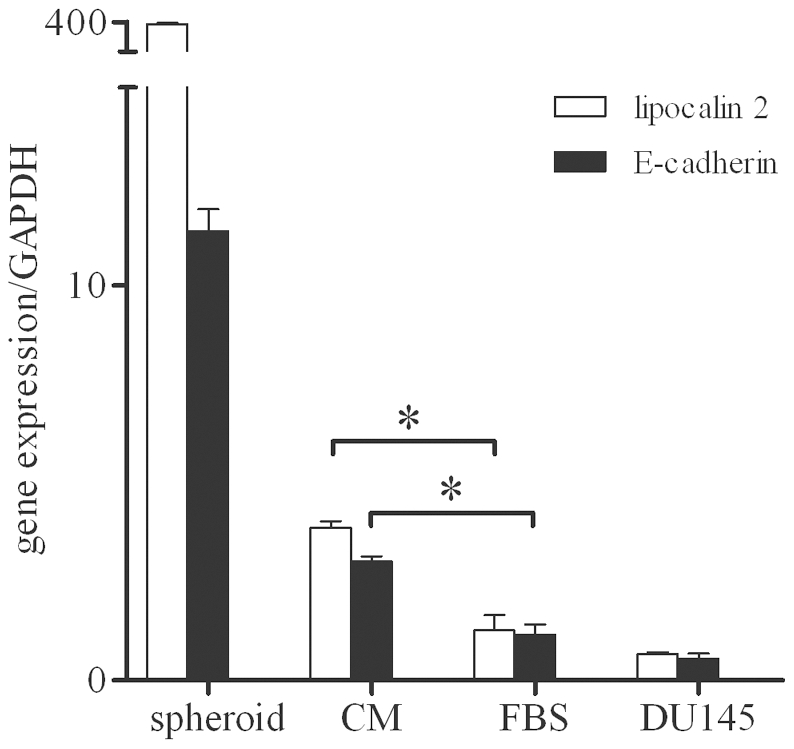
Figure 6. Influence of culture conditions on the expression of lipocalin-2 and E-cadherin in CSC.

Q-PCR showing changes in mRNA levels for lipocalin-2 and E-cadherin in DU145 cells, CSC contained in control spheroids, and CSC grown for 20 days in FBS-medium or CM from DU145 cells. Data represent mean ± SEM from 3 individual experiments. Asterisks indicate a significant difference (*, p<0.05).
