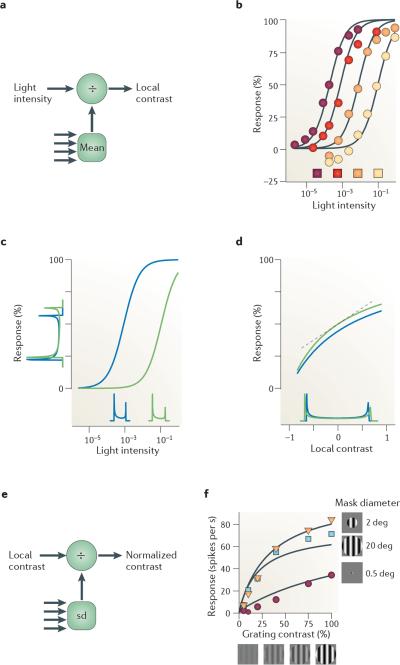
Figure 2. Normalization in retina.
a | Light adaptation operates on light intensity to produce a neural estimate of contrast (multiple arrows indicate light intensities from multiple locations). b | Responses of a turtle cone photoreceptor to light of increasing intensity. The intensity of the coloured squares reflects background intensity. Curves are fits of normalization model (equation 5) with n = 1. c | Light adaptation moves the operating point to suit images of differing intensity. Histograms on abscissa indicate distributions of light intensity for a sinusoidal grating under dim illumination (shown in blue) and bright illumination (shown in green). Histograms on ordinate indicate distributions of responses, which are more similar to one another than the light intensity distributions. d | The same data as in part c | plotted as a function of local contrast (Weber contrast) rather than light intensity. Light adaptation makes responses roughly proportional to local contrast. The linear approximation given by equation 6 is shown (indicated by the dotted line). e | Contrast normalization operates on the neural estimate of contrast and normalizes it with respect to the standard deviation (sd) of nearby contrasts (multiple arrows indicate local contrast from multiple locations). f | Effects of contrast normalization. Responses of a neuron in lateral geniculate nucleus (which receives input from the retina) as a function of grating contrast and size. deg, degrees. Data in part b, from REF. 24. Data in part f, from REF. 40.

