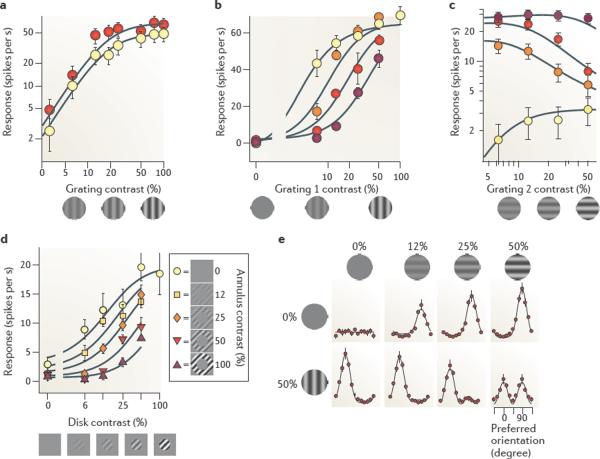
Figure 3. Normalization in primary visual cortex.
a | Contrast saturation. Responses as a function of grating contrast for gratings having optimal orientation (shown in red) and suboptimal orientation (shown in yellow). b | Cross-orientation suppression. Responses to the sum of a test grating and an orthogonal mask grating (colours indicate mask contrast, from 0% (shown in yellow) to 50% (shown in dark red)). c | Transition from drive to suppression. Grating 1 had optimal orientation and grating 2 had suboptimal orientation. Grating 2 could provide some drive to the neuron when presented alone (shown in yellow) but became suppressive when grating 1 had moderate contrasts (shown in red). d | Surround suppression. A grating contained in a central disk was surrounded by a grating in an annulus. The annulus elicited minimal responses when presented alone, but suppressed responses to the central disk. e | Effects of normalization on population responses. Each dot indicates the response of a population of neurons selective for a given orientation, and each panel indicates the population responses to a stimulus. Stimuli are gratings of increasing contrast, presented alone (top) or together with an orthogonal grating (bottom). Data in part a from REF. 43; data in part b from REF. 56; data in part c from REF. 43; data in part d from REF. 142; data in part e from REF. 48.

