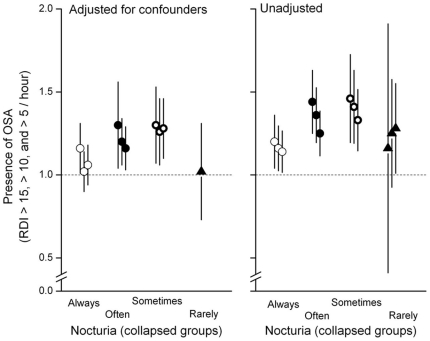
Figure 2. Association between nocturia and presence of sleep-disordered breathing based upon different apnea-hypopnea index (AHI) thresholds are shown as odds ratio (symbol) and 95% confidence intervals (y-error bars).
Odds ratios and respective confidence intervals that were adjusted for confounders (left panel) and unadjusted for confounders (right panel) are shown. The x-axis of each panel represents nocturia expressed as a dichotomous categorical variable (nocturia present or absent) by progressively increasing the threshold level of collapse from ‘rarely’ to ‘always’ to yield four different dichotomous variables for nocturia. The cluster of three symbols with corresponding error bars for each definition of nocturia correspond to variable AHI thresholds for nocturia from left-to-right (>15, >10 and >5 per hour, respectively). For nocturia defined as greater than rarely (closed triangle) only one adjusted odds ratio is shown (left panel) because multivariate regression was performed only if univariate regression was significant at P<0.05 (see methods).

