Figure 1. Validation of endothelial expression of the reporter gene in target cells in vitro.

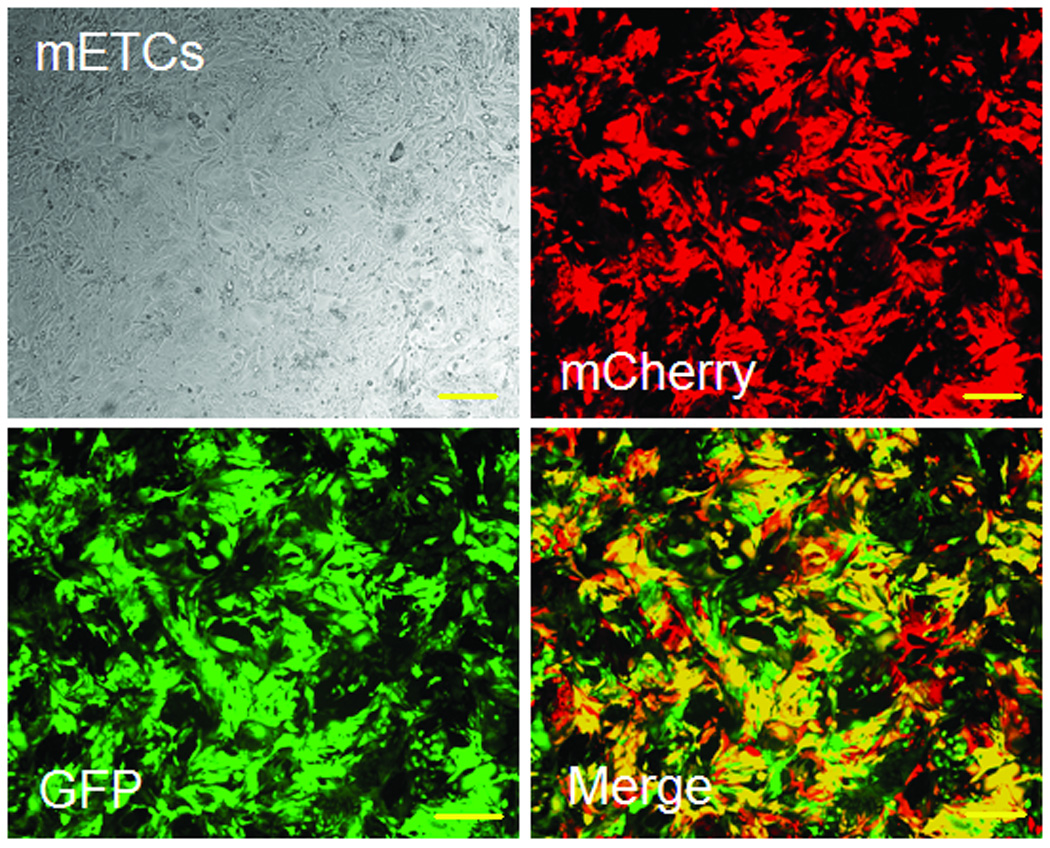
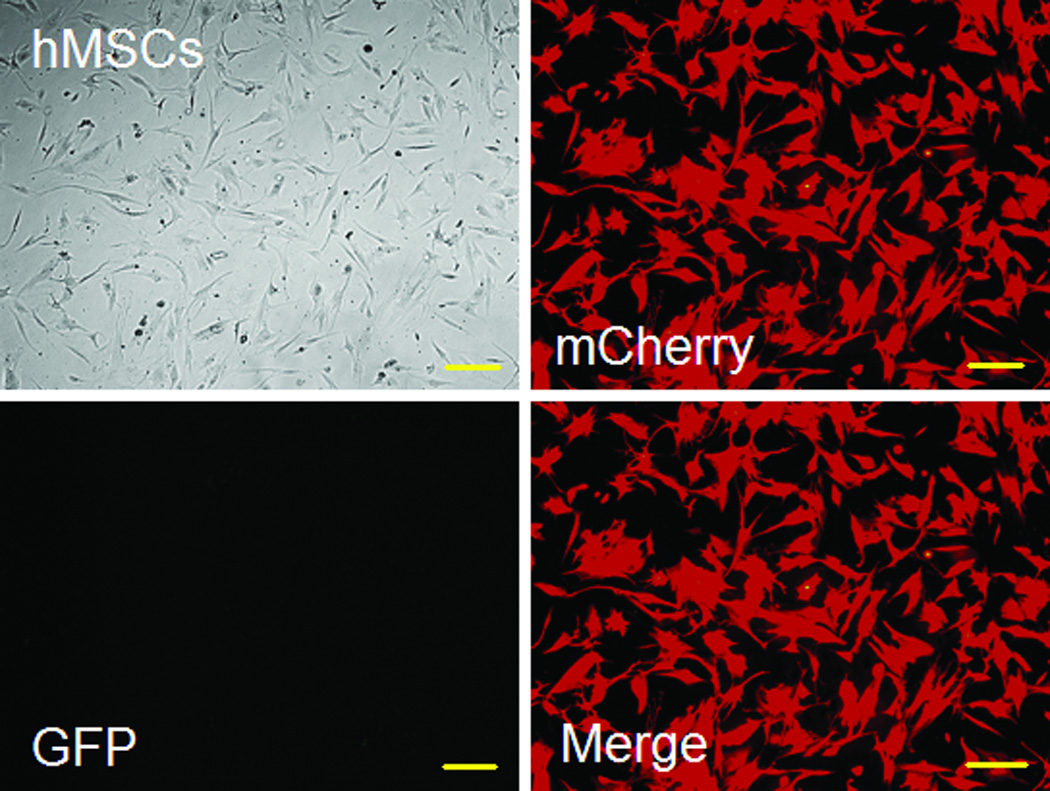
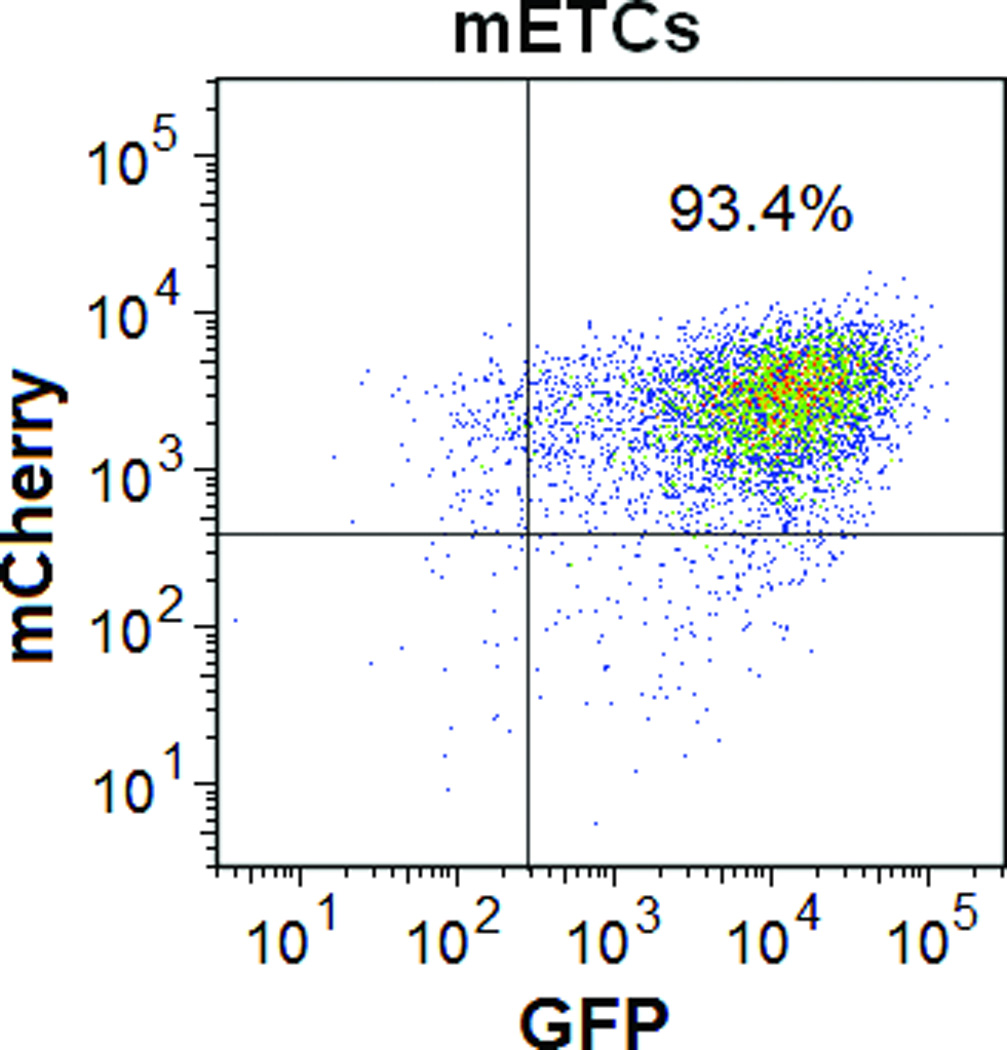
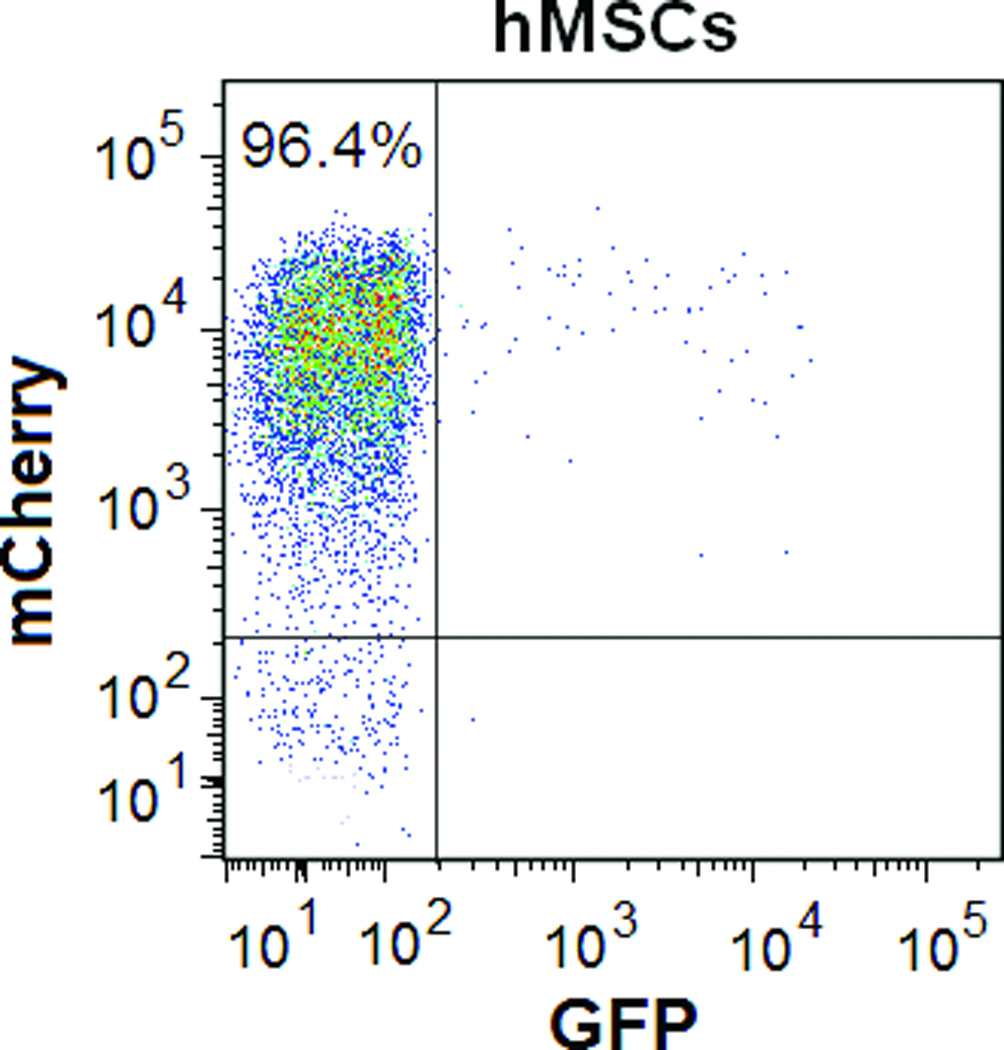
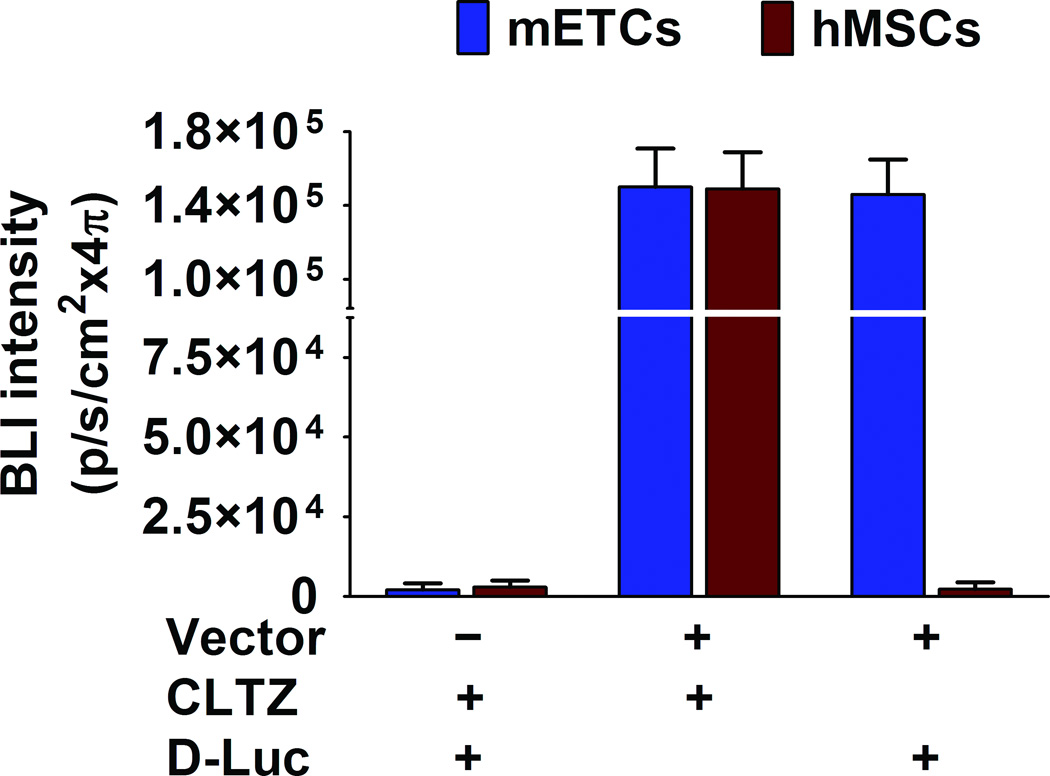
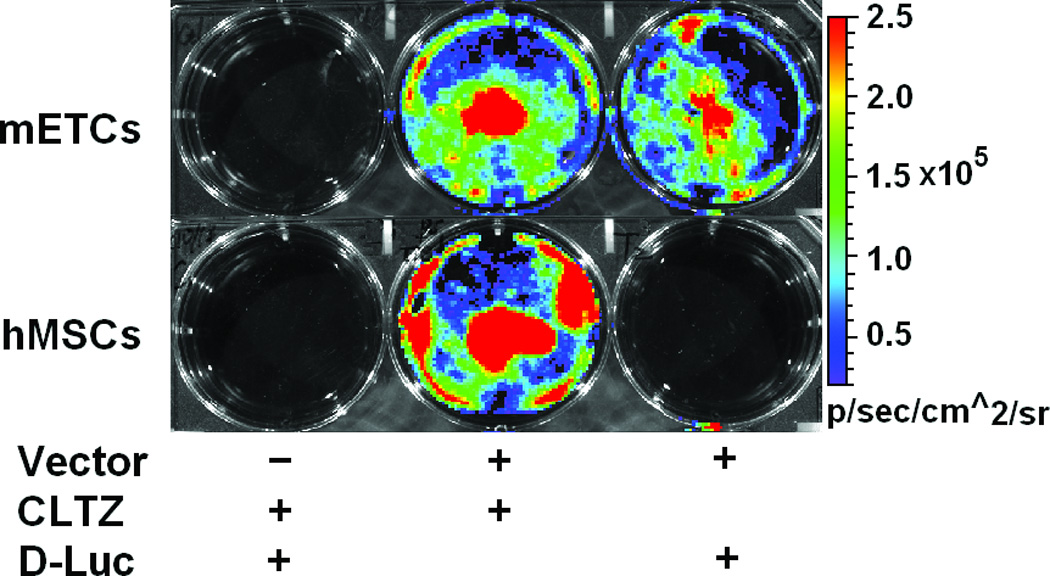
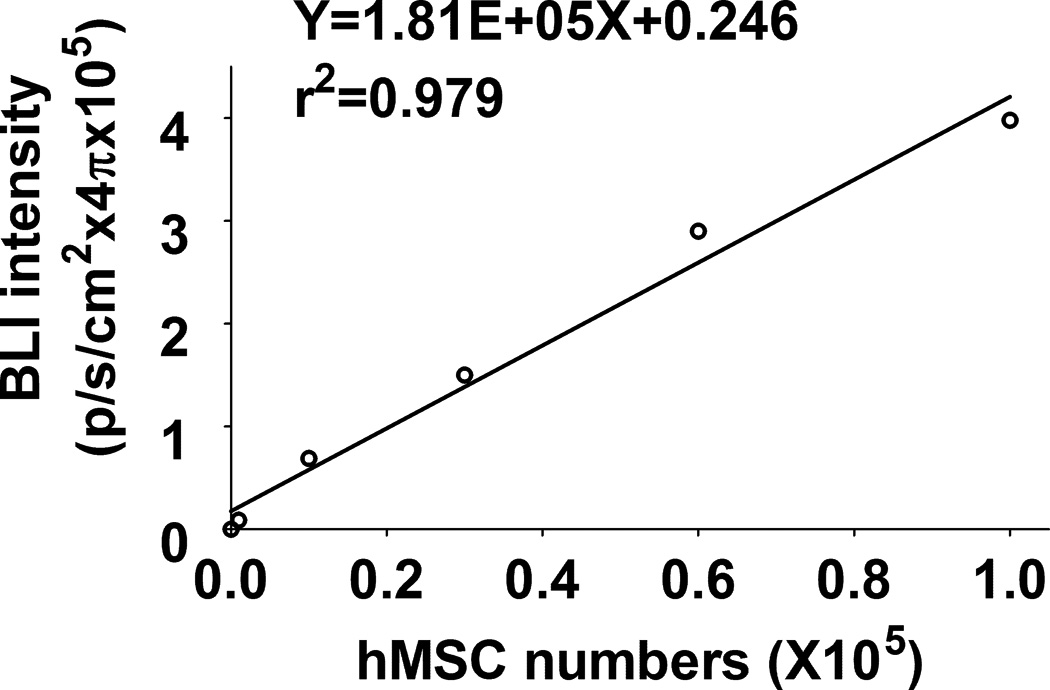
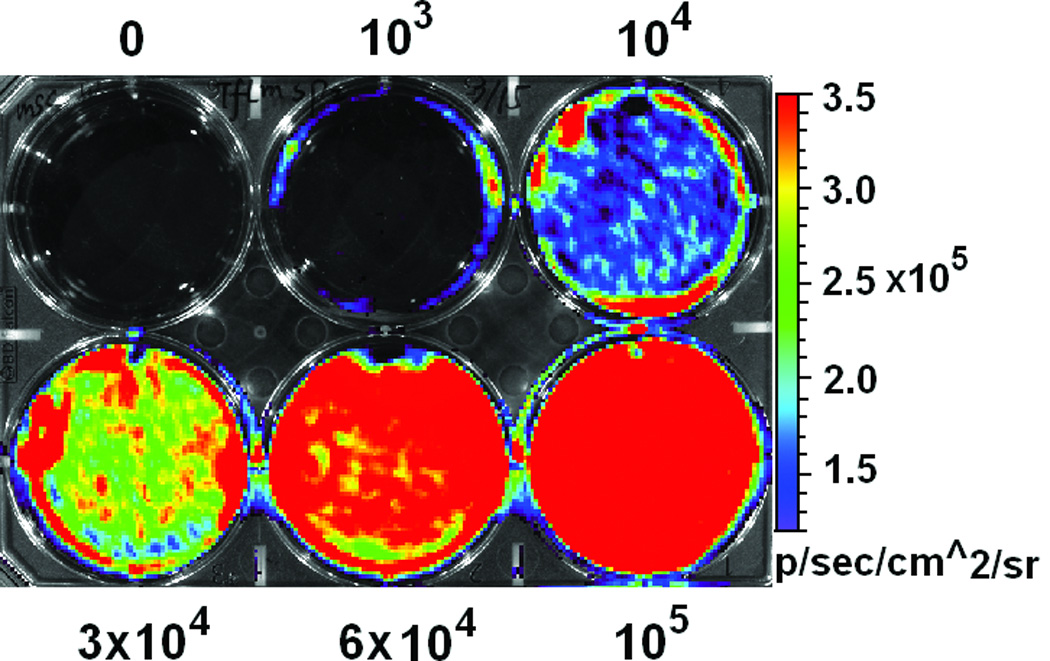
A. Schematic representation of lentivector the dual reporter construct. The mCherry-Renilla luciferase (C/r-Luc) fusion reporter gene is driven by the murine stem cell virus (MSCV) constitutive promoter. The eGFP-firefly luciferase (G/f-Luc) fusion reporter gene is driven by the endothelial cell specific promoter, Tie-2. The transcriptional activity of juxtaposed promoters is oppositely directed. B and C. Representative fluorescent microscopy images illustrate the specific and constitutive expression of reporter genes in mouse endothelial cells (mETCs, positive control) and human mesenchymal stem cells (hMSCs) transduced with lentivirus. Tie-2-driven expression of G/f-Luc in hMSCs was not detected by fluorescence microscopy. Scale bars in B and C, 200 µm. D and E. Flow cytometry data of transduced mETCs and hMSCs illustrate cell-specific expression of reporter genes. The majority of mETCs express both C/r-Luc and G/f-Luc, whereas most hMSCs express only the MSCV-driven C/r-Luc gene. F. In vitro assessment of bioluminescence imaging (BLI) signal in mETCs and hMSCs is shown 72 hours following lentivirus transduction. BLI signal is detected in transduced mETCs with coelenterazine (CLTZ) and D-luciferin (D-Luc) indicating expression of both Tie-2-driven r-Luc and constitutive f-Luc. In contrast, only r-Luc-induced BLI signal is detected in transduced hMSCs. Quantification of the BLI signals (photons/second) is illustrated as a bar graph (bottom). G. BLI of graded numbers (1×10³–1×10⁵) of hMSCs 48 hours following lentivirus transduction was performed to correlate signal intensity and cell number. Quantification of BLI signal intensity shows a robust correlation between r-Luc activity and the number of transduced hMSCs (bottom). The correlation coefficient, r2, is statistically significant (p=0.0001).
