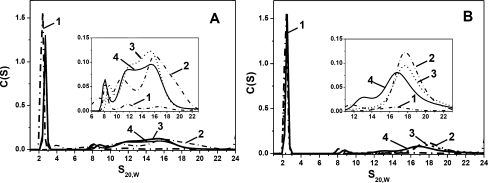
Fig. 8.
Analysis of interaction of oxidized wild-type HspB1 and oxidized Cys mutant of HspB6 (a) and oxidized Cys mutants of HspB5 and HspB6 (b) by means of analytical ultracentrifugation. Distribution of sedimentation coefficients of isolated oxidized Cys mutant of HspB6 (dash-dotted curve 1), of isolated oxidized HspB1 and oxidized Cys mutant of HspB5 (dash-dotted curves 2 on (a, b), respectively), of the unheated mixture of two oxidized small heat shock proteins (dashed curve 3) and of the heated mixture of two oxidized small heat shock proteins (solid curve 4) is presented on each panel. Inserts represent enlarged part of sedimentation profiles in the range of 6–22 S (a) or 12–22 S (b)

