Fig. 5.
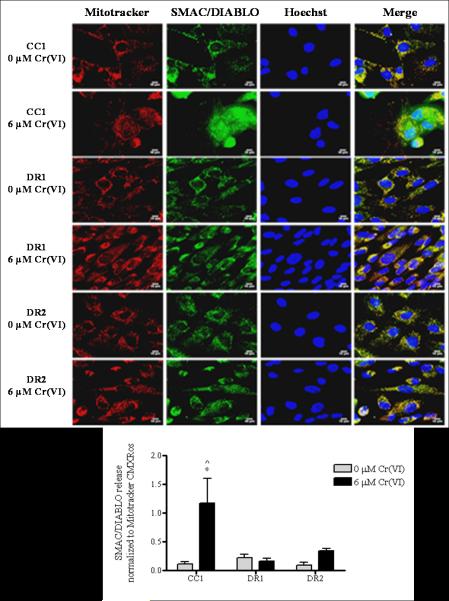
DR cells show no release of SMAC/DIABLO following Cr(VI) treatment. CC1, DR1and DR2 cells were treated with 6 μM Cr(VI) for 24 h. After treatment, the cells were incubated with Mitotracker CMXRos, fixed and incubated with mouse anti-SMAC/DIABLO antibody and Alexa 488-conjugated goat anti-mouse secondary antibody, and DNA was stained with Hoechst. Cells were seeded on 8-well chamber slides prior to treatment. Mitochondria – red; SMAC/DIABLO – green; nucleus – blue. All images were taken on a Zeiss 510 laser scanning microscope at a magnification level of 63 X. Scale bar represents 10 microns. The release of SMAC/DIABLO as assessed by segmentation threshold analysis of mitochondrial versus cytosolic localization was quantified using Image Pro-Plus software. Data are mean +/− SE of three experiments and are normalized to Mitotracker CMXRos. * indicates statistically significant difference from respective untreated control, ^ indicates statistically significant difference from DR1 cells treated with 6 μM Cr(VI) (p < 0.05)

