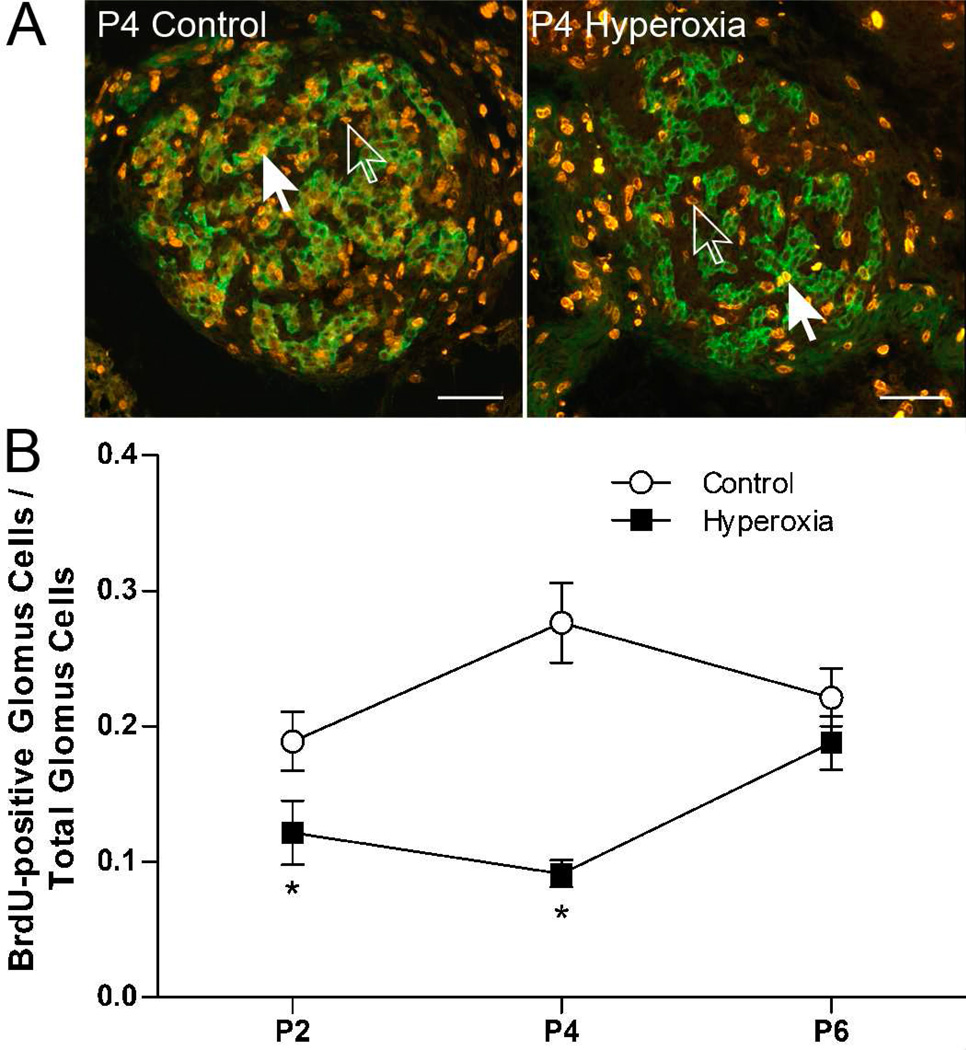
Fig. 5.
(A) Representative photomicrographs showing BrdU-positive cells in the carotid bodies of P4 rats reared in 21% O2 (Control) or 60% O2 (Hyperoxia). Green fluorescence indicates staining for tyrosine hydroxylase, a marker for glomus cells, and orange fluorescence indicates staining for BrdU in the nucleus of cells. Closed arrows point to BrdU-positive glomus cells (green and orange); open arrows point to BrdU-positive non-glomus cells (orange only). Scale bar = 50 µm. (B) The ratio of BrdU-positive glomus cells to the total number of glomus cells in Control and Hyperoxia rats at P2, P4, and P6. BrdU was administered 24 h prior to tissue collection, so labeled cells underwent cell division P1-P2, P3-P4, or P5-P6, respectively. Values are mean ± SEM; n = 6 per treatment group per age. *P<0.05 vs. Control at the same age.

