Fig. 7.
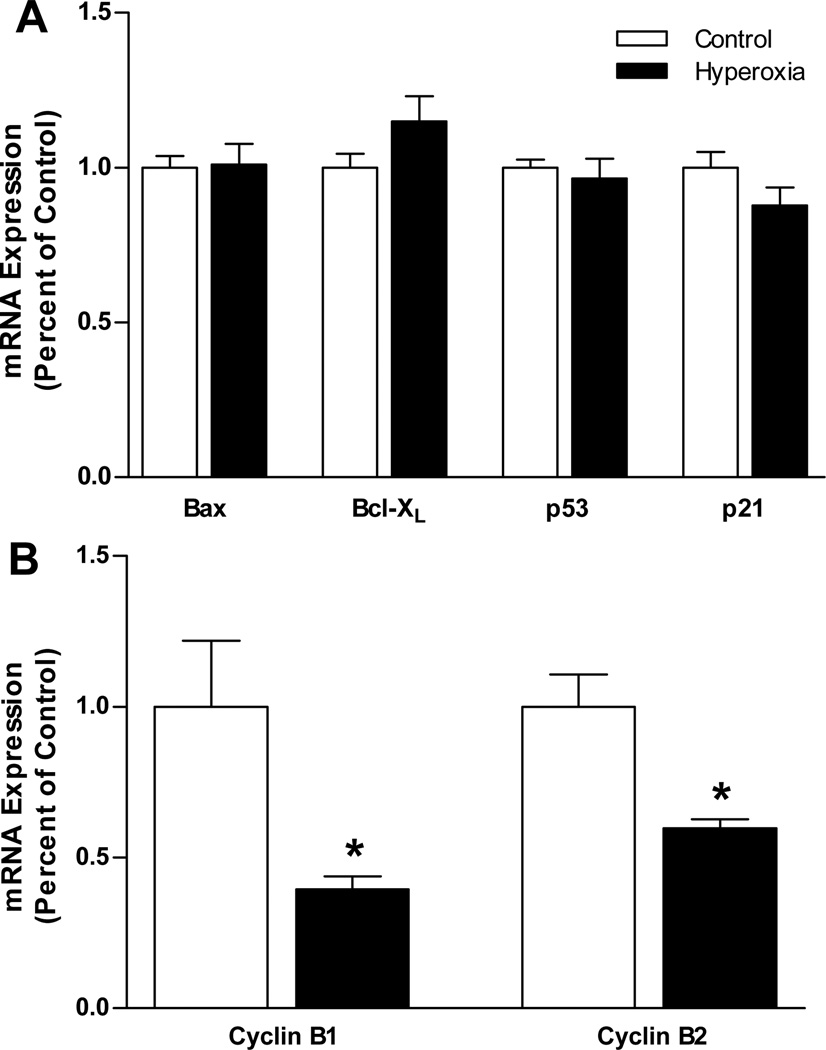
Quantitative RT-PCR analysis of (A) p21, p53, Bax, and Bcl-XL mRNA expression and (B) cyclin B1 and cyclin B2 mRNA expression in the carotid bodies of P3 rats reared in 21% O2 (Control) or 60% O2 (Hyperoxia); mRNA expression was normalized to β-actin. Values are mean ± SEM; n = 7 per treatment group in panel A and 6 per treatment group in panel B. * P<0.05 vs. Control.

