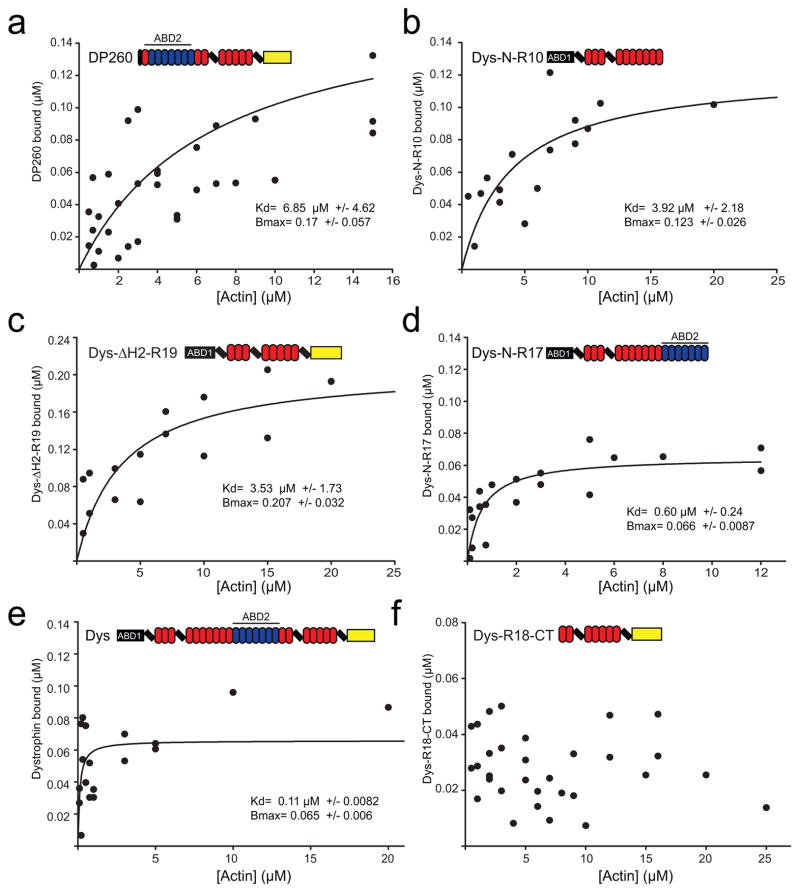
Fig. 2. Analysis of dystrophin actin binding domains.
Binding isotherms from actin cosedimentation assays with increasing actin concentration and a constant concentration of DP260 (a), DysN-R10 (b), Dys ΔH2-R19 (c), DysN-R17 (d), FL-Dystrophin (e) and DysR18-CT (f). Plots display the results from at least three independent experiments on each graph. Binding curves were fit using regression analysis to determine Kd and Bmax (inset). The color code for domain diagrams is the same as in figure 1.

