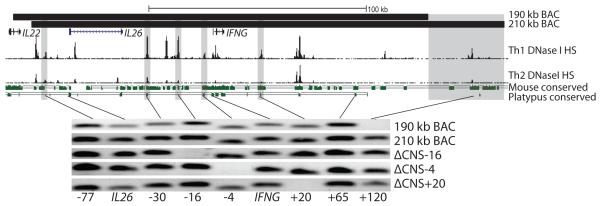
FIGURE 1.
BAC transgenes used in this study. Top: Locations of 190 kb and 210 kb BAC transgenes, Th1 and Th2 DNase I hypersensitivity and conserved sequences between humans and mice or between humans and platypus. Grey bars represent deletion locations. For conservation analysis, green bars are conserved sequences and solid lines represent a fully aligned genome. Bottom: Integration check of transgenes. Shown are human-specific PCR integration checks for BAC transgenic mice.

