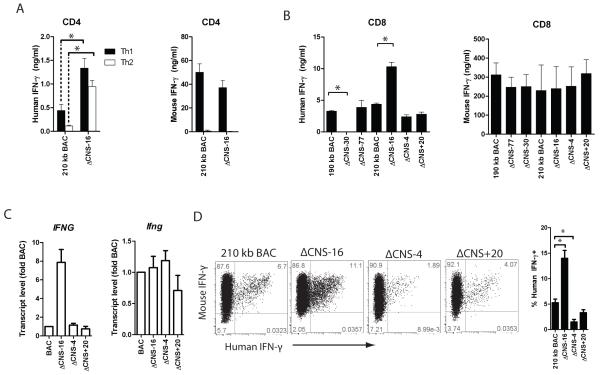
FIGURE 3.
CNS-16 represses human IFN-γ production. A, Transgenic CD4+ cells were cultured under Th1 and Th2 polarizing culture conditions for three days. Human IFN-γ (left) or mouse IFN-γ (right) concentrations were determined in cultures. B, Transgenic CD8+ cells were cultured under Th1 polarizing conditions for three days. IFN-γ was measured in culture by ELSIA. Results are representative of independent replicates. C, Transgenic CD4+ cells were cultured under Th1 conditions for three days and mRNA levels were determined by quantitative PCR. Error bars are standard deviation. D, Transgenic CD8+ T cells were cultured under Th1 polarizing conditions for seven days and restimulated with PMA/Ionomycin. Interferon gamma was determined by intracellular cytokine staining. Quantification of the percentages of human IFN-γ+ cells from three independent replicates is shown. * P < 0.05.

