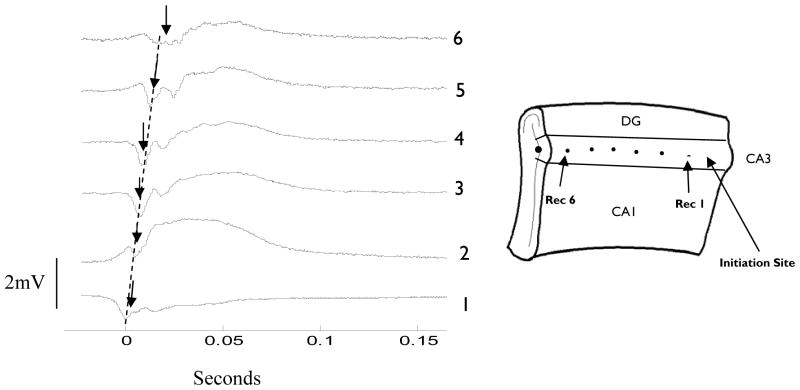
Fig. 6.
Spontaneously generated wave propagating along the CA3 region in the unfolded mouse hippocampus in 50 μM 4-AP. Dashed line indicates propagation speed of 0.11m/s. Trace one is a recording from the temporal pole of the CA3, the trace at location six is recorded from the septal pole of the unfolded hippocampus preparation, and the traces in between are recorded along the longitudinal axis. Peak initial wave amplitude is indicated by arrows.

