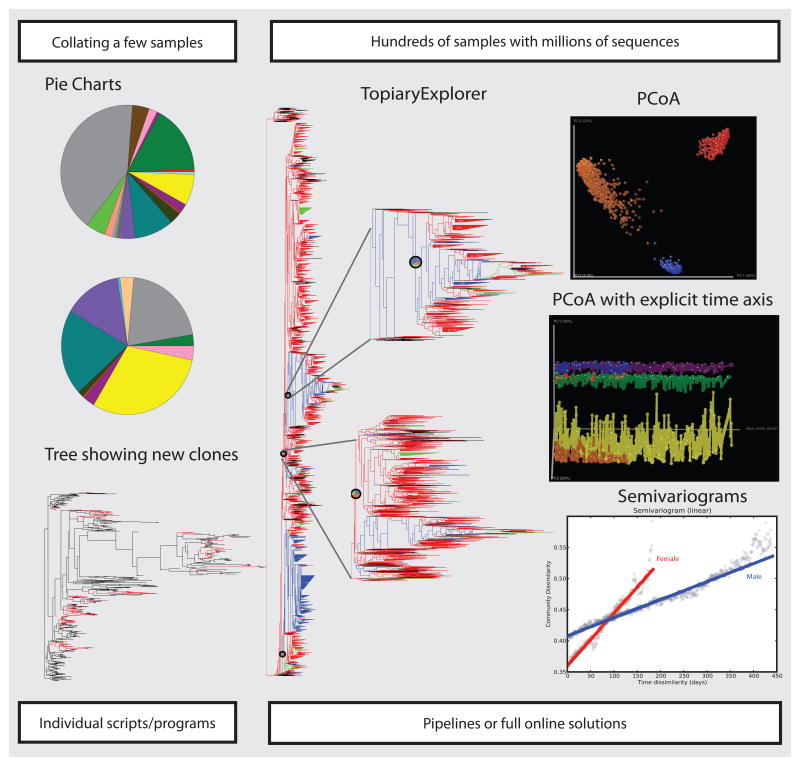
Figure 1. Moving away from pie charts and trees, current analytical methods.
With a few sequences from a small number of samples, pie charts and trees was sufficient for comparing microbial community samples. In contrast, with modern technologies that allow sequencing large number of samples with millions of reads, the new analysis “gold-standard” has moved towards deploying new tools. Here we show data from ref. (6) analyzed with several methods: TopiaryExplorer (41) allows visualization of large trees in the context of per-sample data, , in this example visualizing the GreenGenes reference tree colored by body site matches (red-stool, blue-oral, orange-skin), showing pie charts of most abundant sequences and zooming into the different clades; QIIME PCoA plot comparing all samples color by body site (same colors than in TopiaryExplorer), PCoA with explicit time axis and tracing to follow individuals over time in each body site, allowing visually inspection the changes over time (female: red-gut, blue-oral, orange-skin; male: green-gut, purple-oral, yellow-skin); and semivariograms to assess temporal correlation of observations in the stool samples separated by sex (red-female, blue-male).

