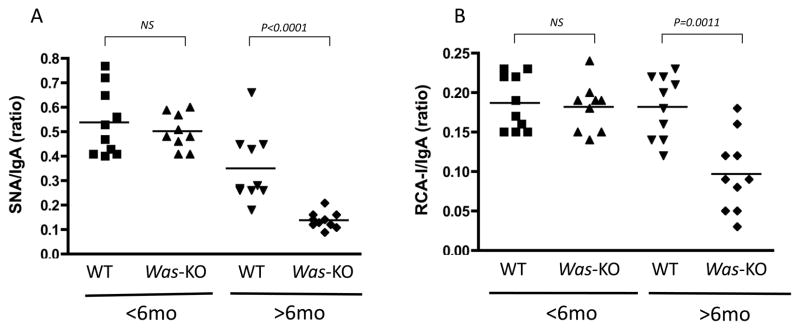
Figure 4. Lectin-binding IgA in sera.
Lectin-binding IgA levels were determined by the specific lectin-binding assays as described in Methods. Data were compared between WT control and Was-KO mice at different time points. The data are shown as the ratios of specific lectin-binding IgA to total IgA for SNA (A) and RCA-I (B).

