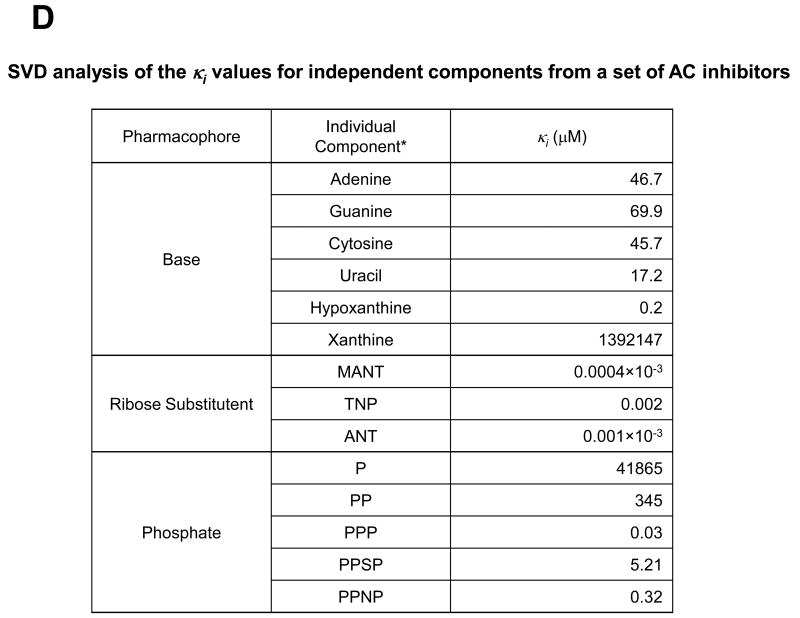
Fig. 2. Crystal structures and general pharmacophore model of VC1·IIC2 in complex with MANT- or TNP-nucleotides or P-site inhibitors.


All data presented in this Figure refer to VC1:IIC2. A, Detailed views of the substrate binding site in the complex of Gαs–activated mAC with the competitive inhibitors MANT-GTP (PDB:1TL7) [23], MANT-ATP (PDB:2GVZ) [24], MANT-ITP (PDB:3G82) [24] and TNP-ATP (PDB:2GVD) [25], and two Mn2+ ions. Structures of inhibitors as bound to their respective complexes with Gαs·VC1:IIC2 are superimposed. The molecular surface was calculated using PYMOL (DeLano Scientific, San Carlos, CA, USA), based on the atomic coordinates of the Gαs·VC1:IIC2·TNP-ATP complex. Ligands are shown as stick models. Carbon atoms are colored magenta for MANT-GTP, cyan for MANT-ATP, yellow for MANT-ITP, and gray for TNP-ATP, nitrogens blue, oxygens red, sulfur yellow, and phosphorous green; the two Mn2+ ions are shown as metallic orange spheres. The secondary structures of VC1 and IIC2 domains are shown in tan and mauve, respectively. Ligands and two metal ions occupy the interdomain cleft between the C1 and C2 domains. Inhibitors prevent transition of the enzyme from the catalytically inactive open conformation to the catalytically active closed conformation because the MANT- and TNP-groups act like rigid body movement-impairing wedges. The MANT- and TNP groups insert into a hydrophobic pocket close to the catalytic site, providing substantial binding energy and giving rise to hydrophobicity-dependent fluorescence increases. Substitution of the 3′-hydroxyl group in MANT- and TNP-nucleotides prevent the 3′:5′-ATP cyclization reaction. B, Comparative views of substrate binding site of the Gαs-activated mAC complex with the prototypical non-competitive/uncompetitive P-site inhibitor, 2′,5′-dideoxy-3′-ATP (PDB:1CUL) [38]. Atoms are colored according to panel A. The Mg2+ ions are shown as metallic limeyellow spheres. Note that 2′,5′-dideoxy-ATP, while occupying the catalytic site, in contrast to MANT- and TNP-nucleotides, does not exploit the hydrophobic pocket. Right-most panels show views of the binding pocket for ribose substitutes of inhibitors and are rotated ∼80° relative to the view shown on the left-most panels. The ribose substituents of inhibitor molecules are positioned between the α4 helix of IIC2 and α1- α2 helices of VC1. C, Structures of MANT-ATP, MANT-GTP, MANT-ITP, and TNP-ATP, as bound to their respective complexes with Gαs·VC1:IIC2 are superimposed and colored as above. Average Ki values are indicated, corresponding to contributions from each type of functional group, derived from singular value decomposition analysis (SVD) D, SVD analysis of the κi values for independent components from a set of AC inhibitors. SVD analysis was performed as described [16] using published Ki values as basis [22,24,28]. P, monophosphate; PP diphosphate; PPP for triphosphate; PPSP, [γ-thio]triphosphate; PPNP, [β,γ-imido]triphosphate.

