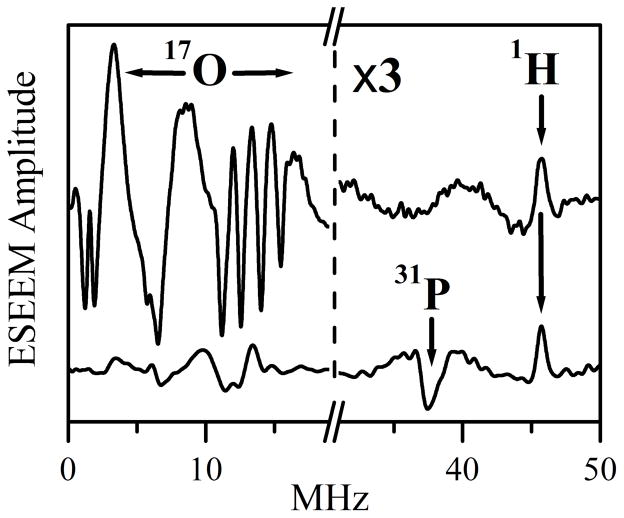
Figure 3.
Ka-band two-pulse ESEEM spectra (cosine FT) of Species 1 (upper trace) and Species 1P (lower trace) obtained at the EPR position indicated by the arrow in Figure 2. Experimental conditions: mw frequency = 30.068 GHz; Bo = 1074 mT; mw pulses, 2×12 ns; temperature = 21 K. For clarity, the modulation amplitudes to the right of the break in the x-axis have been magnified by a factor of 3. The proton matrix line is marked by the arrow labeled “1H” (at ~46 MHz, which corresponds to the 1H Larmor frequency, νH). Likewise, the arrow labeled “31P” indicates the position of the sum combination line of 31P (νσ = ~37.5 MHz), which is close to double the Larmor frequency of 31P at this magnetic field, 2νP ≈ 37.1 MHz.

