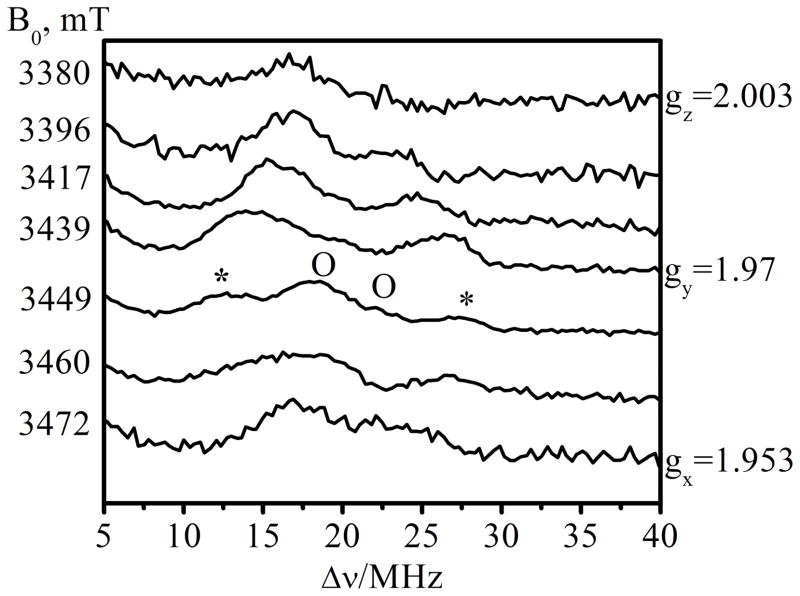
Figure 5.
ED-NMR spectra of Species 1 measured at different magnetic field positions (indicated on the left side of each trace). The largest hyperfine coupling (observed at 3449 mT) is labeled by “*”. The spectral features of the weakly coupled 17O (observable on the same trace and labeled by “O”) are centered about the 17O Larmor frequency (νO ~ 20 MHz) and are separated by ~4.5 MHz. The field positions of gx, gy, and gz that correspond to the labeled traces are shown in Figure S6. Experimental conditions: preparation (probing) mw pulse = 10 μs; the observation two-pulse sequence consisted of 100 ns (π/2) and 200 ns (π) pulses separated by a time interval (τ) of 400 ns. The time interval between the preparation and observation pulses was 10 μs; observation mw frequency = 94.897 GHz; temperature = 21 K.

