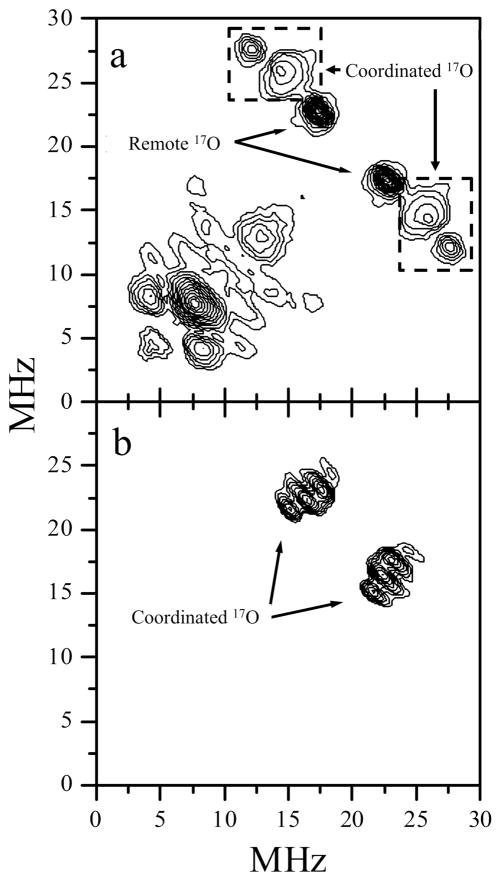
Figure 6.
W-band HYSCORE spectra of Species 1 obtained at the gy (a) and gx (b) EPR spectrum positions. The spectra represent the sums of the spectra that were obtained at time intervals (τ) between the first two mw pulses of 137 and 175 ns. The correlation lines of coordinated and remote 17O are indicated. Experimental conditions: mw frequency = 94.897 GHz; Bo = 3441.7 mT (a) and 3472.9 mT (b); mw pulses = 12.5, 12.5, 25, and 12.5 ns; temperature = 21 K.

