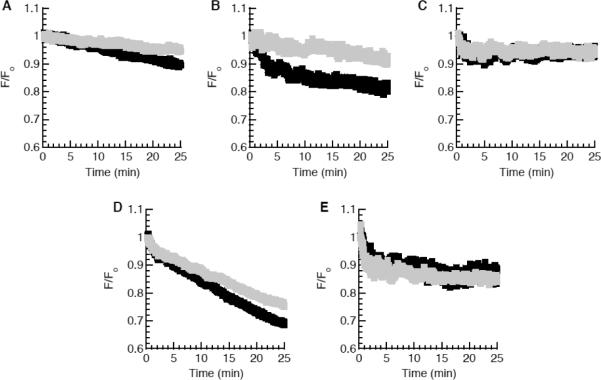
Figure 2.
Translocation of BF2 (A), DesHDAP1 (B), DesHDAP3 (C), DesHDAP1 P11A (D), and DesHDAP3 P13A (E) across lipid vesicle membranes. Peptides (3 μM) were exposed to lipid vesicles (250 μM) containing trypsin. The FRET signal at 525 nm (black) is plotted as the fluorescent signal throughout the experiment relative to the initial fluorescent signal (F/Fo). In control traces (gray), peptides were exposed to vesicles containing both trypsin and trypsin inhibitor.

