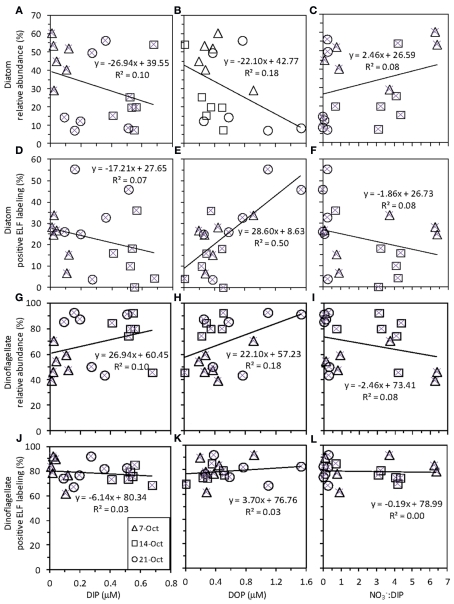
Figure 7.
Correlations between seawater nutrient (DIP, DOP, and ) and phytoplankton data (diatom and dinoflagellate relative abundance and ELF labeling). Each panel shows data for all six stations on each of three sampling dates [legend as in (J) for all panels]. Each panel shows the best fit line and correlation coefficient for all data points together.

