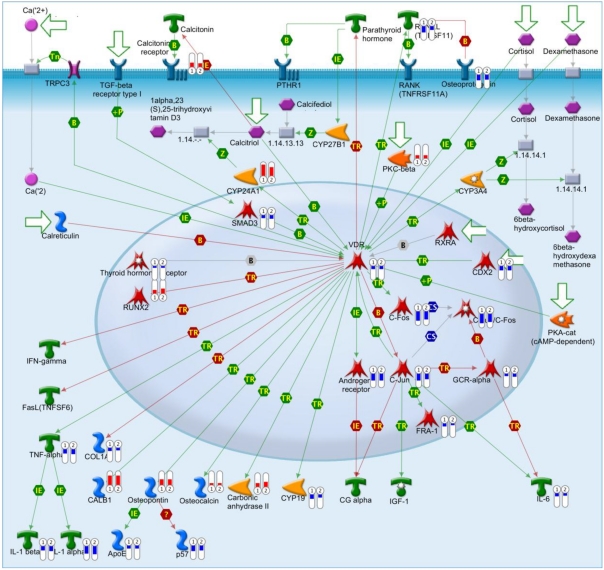
Figure 2.
The vitamin D receptor pathway. Genes that were differentially expressed in the tumor in both replicates (Array #1 and Array #2 in Additional File 1: Supplementary Table S1) were mapped on pathway. The relative expression of the genes was visualized by thermometer-like symbols next to the protein icons (Red indicates upregulation, blue indicates downregualtion and the height of the bar indicates the level of change relative to normal control). Detailed legends are depicted in Additional file 2: Supplementary Figure S1.

