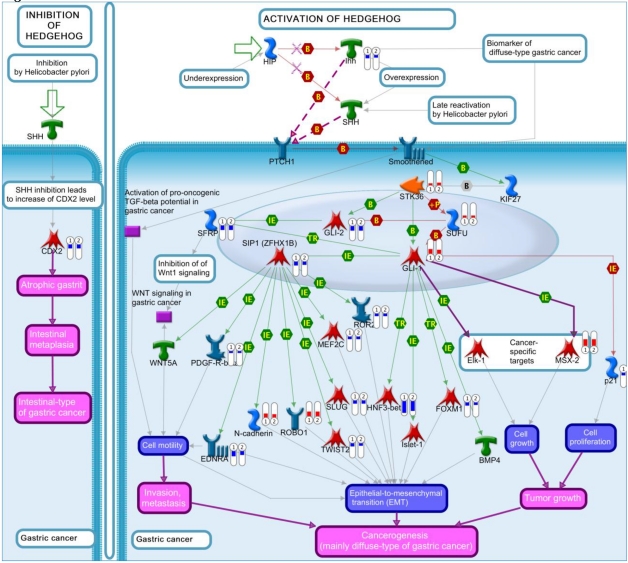
Figure 3.
The hedgehog pathway. Genes that were differentially expressed in the tumor in both replicates (Array #1 and Array #2 in Additional File 1: Supplementary Table S1) were mapped on pathway. The gene expression data were represented in the map as described in Figure 2.

