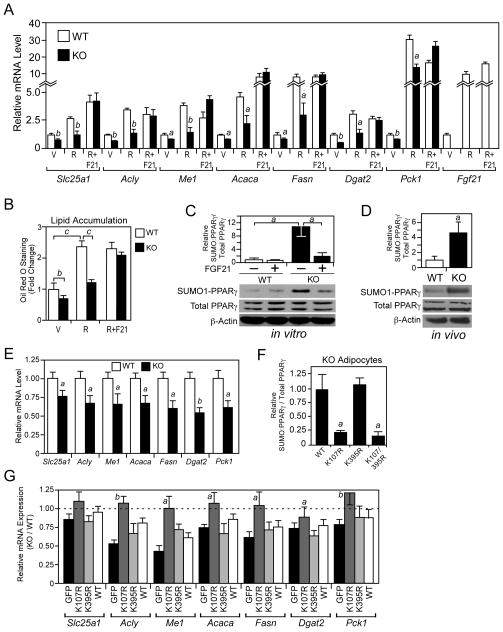
Figure 4. FGF21-knockout adipocytes have reduced PPARγ activity.
(A–B) Stromal vascular fraction preadipocytes isolated from P4 wild-type (WT) and FGF21-knockout (KO) mice were differentiated for 8 days in the presence of 0.5 μM rosiglitazone (R), 0.5 μM rosiglitazone + 100 ng/ml FGF21 (R+F21) or vehicle (V). (A) Gene expression was measured by RT-qPCR. a, p<0.05 vs WT; b, p<0.01 vs WT. (B) Lipid accumulation was measured by oil red O staining. b, p<0.01; c, p<0.005. (C) Sumoylated and total PPARγ protein levels were measured in WT and FGF21-KO adipocytes differentiated for 8 days and treated with vehicle or FGF21 (200 ng/ml) for 4 hours prior to harvest. Sumoylated PPARγ was detected by immunoprecipitation with a SUMO1 antibody followed by western blot analysis with a PPARγ antibody. Phosphorylated and total PPARγ and β-actin were detected by western blot. Top panel, quantification by densitometry of sumoylated PPARγ normalized to total PPARγ is shown for an experiment performed in triplicate. a, p<0.05. Bottom panel, representative western blots are shown. (D) Sumoylated and total PPARγ protein levels were measured as in (C) in epididymal WAT extracts from 2- to 3-month-old male WT and FGF21-KO mice fed regular chow and killed in the fed state. Top panel, quantification by densitometry of sumoylated PPARγ normalized to total PPARγ for WT and KO mice (n=4/group). a, p<0.05. Bottom panel, western blots for pooled samples are shown. (E) Gene expression was measured by RT-qPCR in the epididymal WAT of 2- to 3-month-old, male WT and FGF21-KO mice killed during the fed state (n=6–7/group). a, p<0.05 vs WT; b, p<0.01 vs WT. (F) Flag-tagged PPARγ2, PPARγ2-K107R, PPARγ2-K395R or PPARγ2-K107R/K395R were introduced into primary FGF21-KO adipocytes by transfection and their sumoylation measured by immunoprecipitation with a Flag antibody followed by western blot analysis with either a SUMO1 or PPARγ antibody. Input levels of Flag-tagged PPARγ and the PPARγ mutants were determined by western blot analysis with a Flag antibody. Data were quantified by densitometry. a, p<0.05 vs WT. (G) Gene expression was measured by RT-qPCR in WT and FGF21-KO stromal vascular fraction preadipocytes transduced with lentiviruses expressing PPARγ2, PPARγ2-K107R, PPARγ2-K395R or GFP control and differentiated for 4 days. PPARγ2, PPARγ2-K107R, PPARγ2-K395R were expressed at comparable levels (Figure S3E). Data are plotted as relative mRNA expression in FGF21-KO adipocytes compared to WT adipocytes. a, p<0.05 vs GFP; b, p<0.01 vs GFP. Error bars represent the mean ± SEM. See also Supplemental Figure S3.

