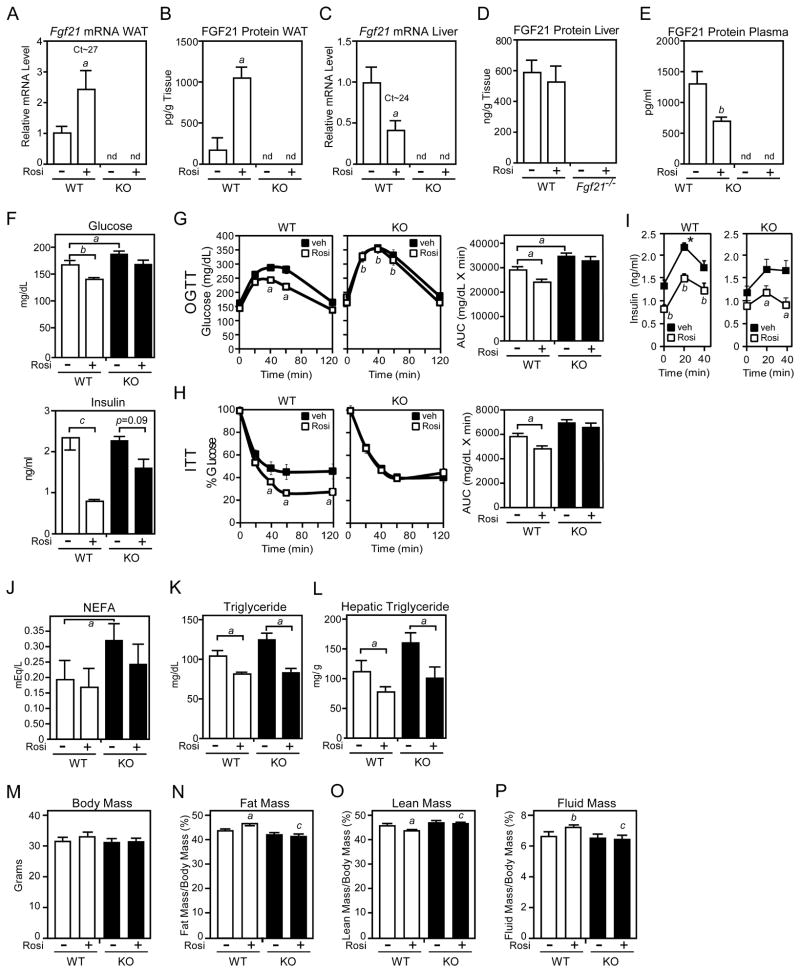
Figure 5. FGF21-knockout mice are refractory to rosiglitazone treatment.
(A–P) Two- to 3-month-old male wild-type (WT) and FGF21-knockout (KO) mice were fed a high fat diet for 10 weeks. During the last two weeks, groups of mice were administered rosiglitazone (10 mg/kg) or vehicle (1% methylcellulose). The following parameters were measured: (A) Fgf21 mRNA in epididymal WAT by RT-qPCR; (B) FGF21 protein in epididymal WAT by ELISA; (C) Fgf21 mRNA in liver by RT-qPCR; (D) FGF21 protein in liver by ELISA; (E) Plasma FGF21 by ELISA; (F) Plasma glucose and insulin; (G) Plasma glucose concentrations for glucose tolerance tests in mice fasted for 8 hours; (H) Plasma glucose levels for insulin tolerance tests in mice fasted for 4 hours; (I) Plasma insulin concentrations during the glucose tolerance test; (J) Plasma non-esterified fatty acid concentrations; (K) Plasma triglyceride concentrations; (L) Hepatic triglyceride concentrations; (M) Body mass; (N) Fat mass; (O) Lean mass; (P) Fluid mass. For (A–E), n=5–6/group; for (F–I), n=13–16/group; for (J–P), n=5–6/group. For (A–E), a, p<0.05 vs WT, vehicle; b, p<0.01 vs WT, vehicle; for (F), a, p<0.05; b, p<0.01; c, p<0.005; for (G) and (H), left panels, a, p<0.05 vs WT, vehicle; b, p<0.01 vs WT, vehicle; for (G) and (H), right panels, a, p<0.05; for (I), a, p<0.05 vs vehicle; b, p<0.01 vs vehicle; * p<0.05 vs FGF21-KO; for (J–L), a, p<0.05; for (N–P) a, p<0.05 versus WT, vehicle; b, p<0.01 versus WT, vehicle; c, p<0.05 versus WT, rosiglitazone. Error bars represent the mean ± SEM. See also Supplemental Figure S4.

