Figure 8.
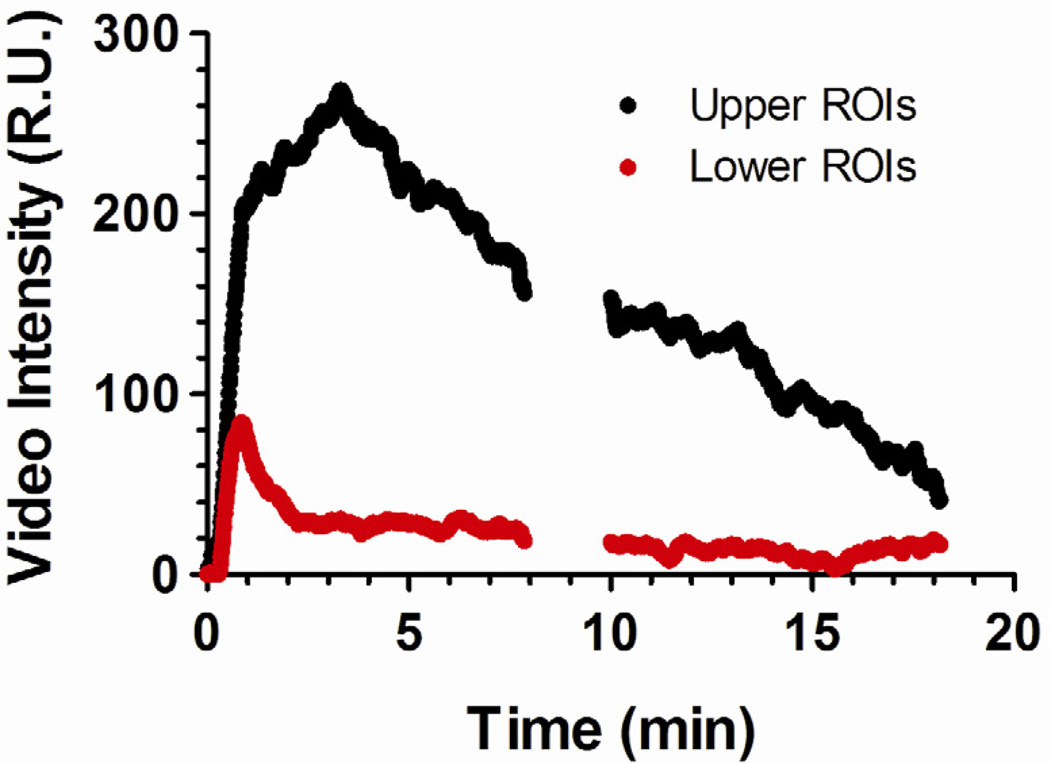
Persistence half-life and 25% time point of microbubbles obtained using the one-compartment pharmacokinetic model. The half-life (A) was determined from the TIC data at which the signal intensity decayed to half of its maximum amplitude, and the 25% time point (B) was determined at which the signal intensity decayed to 25% of its maximum amplitude. Significant persistence difference was measured between ELA-RGD and ELA-control (P < 0.01 for both persistence half-life and 25% time point), while BLA-RGD and BLA-control microbubbles showed similar circulation time (P = 0.86 for persistence half-lfie and P = 0.84 for 25% time point). This data supported the hypotheses that exposed RGD may lower in vivo circulation time, and the PEG overbrush may increase it back to control levels.

