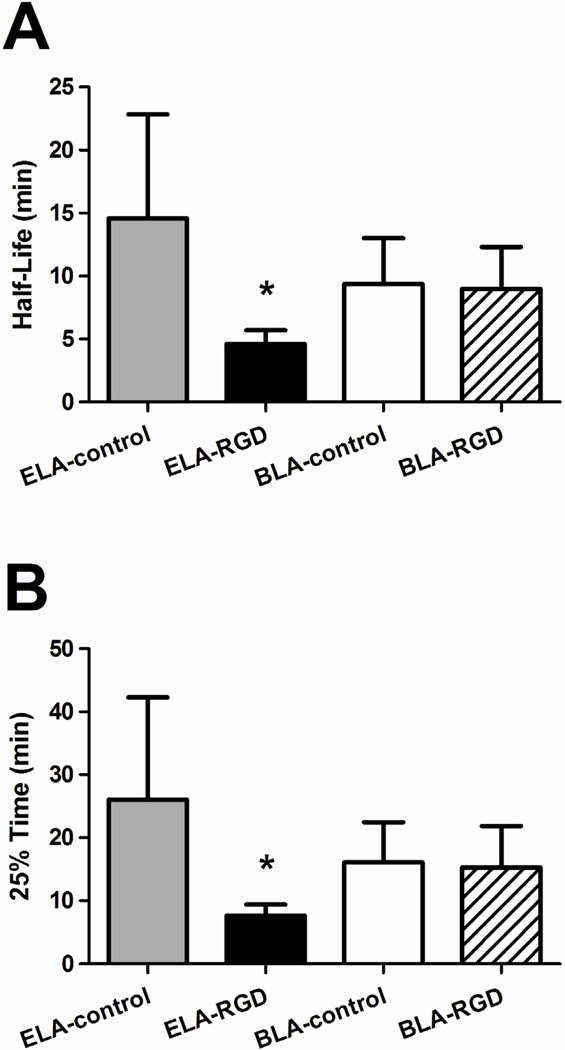
Figure 9.
Fitted parameters of the TIC data using the one-compartment pharmacokinetic model. The parameters were determined using least-squares regression. (A) C0 is proportional to the signal amplitude. No significant difference was measured across microbubble samples (P = 0.23 for ELA-control vs. ELA-RGD, P = 0.57 for ELA-control vs. BLA-control and P = 0.85 for BLA-RGD vs. BLA-control). (B) k1 is a measure of the influx rate of the microbubbles into the kidney. No significant difference was measured across the samples (P = 0.95 for ELA-control vs. ELA-RGD, P = 0.75 for ELA-control vs. BLA-control and P = 0.69 for BLA-RGD vs. BLA-control). (C) k2 is a measure of the decay rate of the microbubble signal. ELA-RGD showed significantly more rapid contrast elimination when compared to BLA-RGD (P < 0.05), ELA-control (P < 0.001) or BLA-control (P < 0.001).

