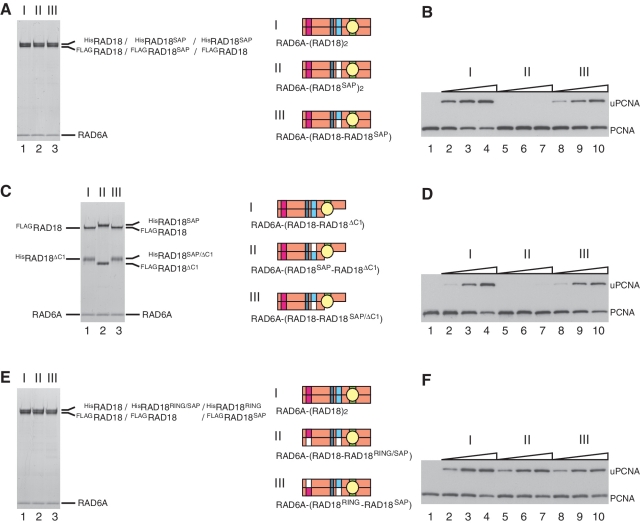
Figure 8.
Analysis of ligase activity and complex formation of a SAP mutant of RAD18. (A) Purified complexes (3.7 pmol) were analyzed by SDS–PAGE followed by staining with CBB. I, RAD6A–(HisRAD18–FLAGRAD18); II, RAD6A–(HisRAD18SAP–FLAGRAD18SAP); III, RAD6A–(HisRAD18SAP–FLAGRAD18). Structures were represented schematically, SAP domains with a mutation being shown in white boxes. (B) Ligase activities of the respective RAD6A–RAD18 complexes. Increasing amounts of the complexes (0.5, 1 and 2 pmol) shown in (A) were subjected to standard assays. (C) Purified complexes (3.7 pmol) were analyzed by SDS–PAGE followed by staining with CBB. I, RAD6A–(HisRAD18ΔC1–FLAGRAD18); II, RAD6A–(HisRAD18SAP–FLAGRAD18ΔC1); III, RAD6A–(HisRAD18SAP/ΔC1–FLAGRAD18). (D) Ligase activities of the respective RAD6A–RAD18 complexes. Increasing amounts of the complexes (0.5, 1 and 2 pmol) shown in (C) were subjected to standard assays. (E) Purified complexes (3.7 pmol) were analyzed by SDS–PAGE followed by staining with CBB. I, RAD6A–(HisRAD18–FLAGRAD18); II, RAD6A–(HisRAD18RING/SAP–FLAGRAD18); III, RAD6A–(HisRAD18RING–FLAGRAD18SAP). (F) Ligase activities of the respective RAD6A–RAD18 complexes. Increasing amounts of the complexes (0.5, 1 and 2 pmol) shown in (E) were subjected to standard assays.

